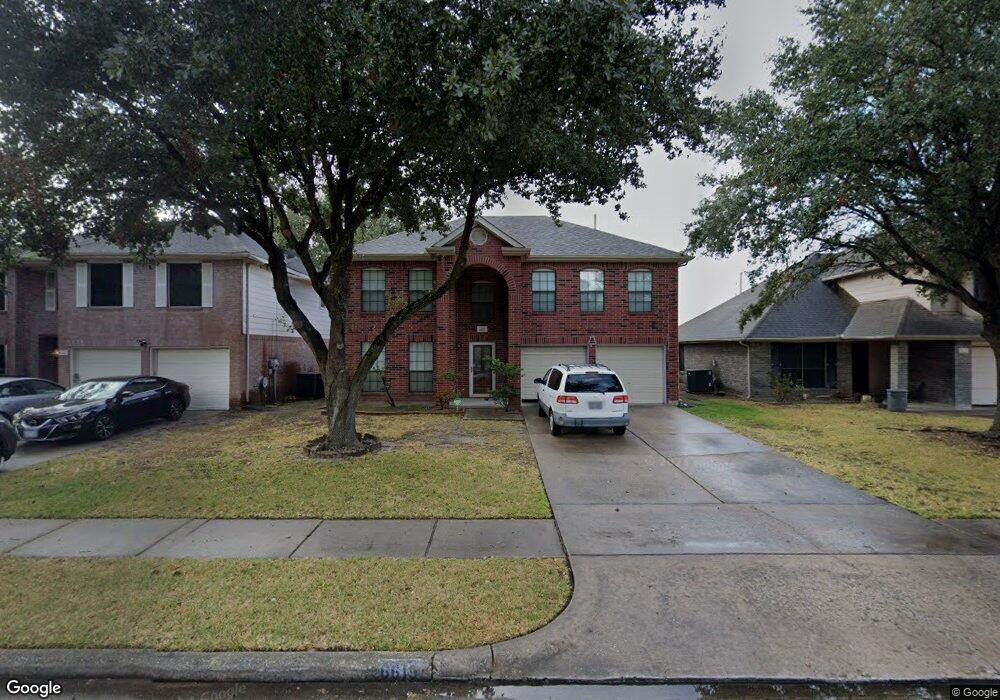
6619 Sutton Meadows Dr Houston, TX 77086
North Houston NeighborhoodEstimated Value: $256,554 - $280,000
3
Beds
3
Baths
2,468
Sq Ft
$107/Sq Ft
Est. Value
About This Home
This home is located at 6619 Sutton Meadows Dr, Houston, TX 77086 and is currently estimated at $264,889, approximately $107 per square foot. 6619 Sutton Meadows Dr is a home located in Harris County with nearby schools including Kujawa EC/Pre-K/K School, Shotwell Middle School, and Davis Ninth Grade.
Ownership History
Date
Name
Owned For
Owner Type
Purchase Details
Closed on
Jan 27, 2006
Sold by
Hud
Bought by
Tuan Trinh and Thuy Mai Trang
Current Estimated Value
Home Financials for this Owner
Home Financials are based on the most recent Mortgage that was taken out on this home.
Original Mortgage
$58,500
Outstanding Balance
$32,972
Interest Rate
6.22%
Mortgage Type
Fannie Mae Freddie Mac
Estimated Equity
$231,917
Purchase Details
Closed on
Jul 15, 2005
Sold by
Mortgage Electronic Registration Systems
Bought by
Hud
Purchase Details
Closed on
Jul 5, 2005
Sold by
Insaard Sirigunya May and Oudornsom Phetsamorn
Bought by
Mortgage Electronic Registration Systems
Purchase Details
Closed on
Feb 27, 2001
Sold by
Kb Home Lone Star Lp
Bought by
Insaard Sirigunya May and Oudornsom Phetsamorn
Home Financials for this Owner
Home Financials are based on the most recent Mortgage that was taken out on this home.
Original Mortgage
$133,149
Interest Rate
7.19%
Mortgage Type
FHA
Create a Home Valuation Report for This Property
The Home Valuation Report is an in-depth analysis detailing your home's value as well as a comparison with similar homes in the area
Home Values in the Area
Average Home Value in this Area
Purchase History
| Date | Buyer | Sale Price | Title Company |
|---|---|---|---|
| Tuan Trinh | -- | First American Title | |
| Hud | -- | -- | |
| Mortgage Electronic Registration Systems | $176,301 | -- | |
| Insaard Sirigunya May | -- | -- |
Source: Public Records
Mortgage History
| Date | Status | Borrower | Loan Amount |
|---|---|---|---|
| Open | Tuan Trinh | $58,500 | |
| Previous Owner | Insaard Sirigunya May | $133,149 |
Source: Public Records
Tax History
| Year | Tax Paid | Tax Assessment Tax Assessment Total Assessment is a certain percentage of the fair market value that is determined by local assessors to be the total taxable value of land and additions on the property. | Land | Improvement |
|---|---|---|---|---|
| 2025 | $4,887 | $273,969 | $36,563 | $237,406 |
| 2024 | $4,887 | $281,404 | $36,563 | $244,841 |
| 2023 | $4,887 | $281,404 | $37,505 | $243,899 |
| 2022 | $5,458 | $254,209 | $28,850 | $225,359 |
| 2021 | $4,950 | $205,119 | $28,850 | $176,269 |
| 2020 | $5,003 | $202,240 | $28,850 | $173,390 |
| 2019 | $4,729 | $173,965 | $19,907 | $154,058 |
| 2018 | $1,840 | $157,247 | $19,907 | $137,340 |
| 2017 | $3,768 | $147,654 | $17,887 | $129,767 |
| 2016 | $3,426 | $147,654 | $17,887 | $129,767 |
| 2015 | $2,504 | $127,892 | $17,887 | $110,005 |
| 2014 | $2,504 | $110,772 | $17,887 | $92,885 |
Source: Public Records
Map
Nearby Homes
- 6622 Sutton Meadows Dr
- 6631 Sutton Meadows Dr
- 6607 Redding Springs Ln
- 0 Tomball Pkwy
- 12655 Redbud Villa Ln
- 6411 Halstead Meadows Cir
- 6307 Sutton Meadows Dr
- 12611 Atwood Grove Ln
- 9815 Lonsford Dr
- 6830 Desert Rose Ln
- 6615 Deer Ridge Ln
- 12611 Providence Cove Ct
- 6830 Deer Ridge Ln
- 10214 Trade Winds Dr
- 10203 Heather Hill Dr
- 10306 Jillana Kaye Dr
- 00 Romona Blvd
- 6927 Silver Star Dr
- 10307 Bammel North Houston Rd
- 6502 Trail Valley Way
- 6623 Sutton Meadows Dr
- 6615 Sutton Meadows Dr
- 6627 Sutton Meadows Dr
- 6611 Sutton Meadows Dr
- 6607 Sutton Meadows Dr
- 6618 Sutton Meadows Dr
- 6614 Sutton Meadows Dr
- 6635 Sutton Meadows Dr
- 6603 Sutton Meadows Dr
- 6626 Sutton Meadows Dr
- 6610 Sutton Meadows Dr
- 6630 Sutton Meadows Dr
- 6606 Sutton Meadows Dr
- 6703 Sutton Meadows Dr
- 6634 Sutton Meadows Dr
- 6602 Sutton Meadows Dr
- 6619 Lower Arrow Dr
- 6623 Lower Arrow Dr
- 6615 Lower Arrow Dr
- 6707 Sutton Meadows Dr
Your Personal Tour Guide
Ask me questions while you tour the home.