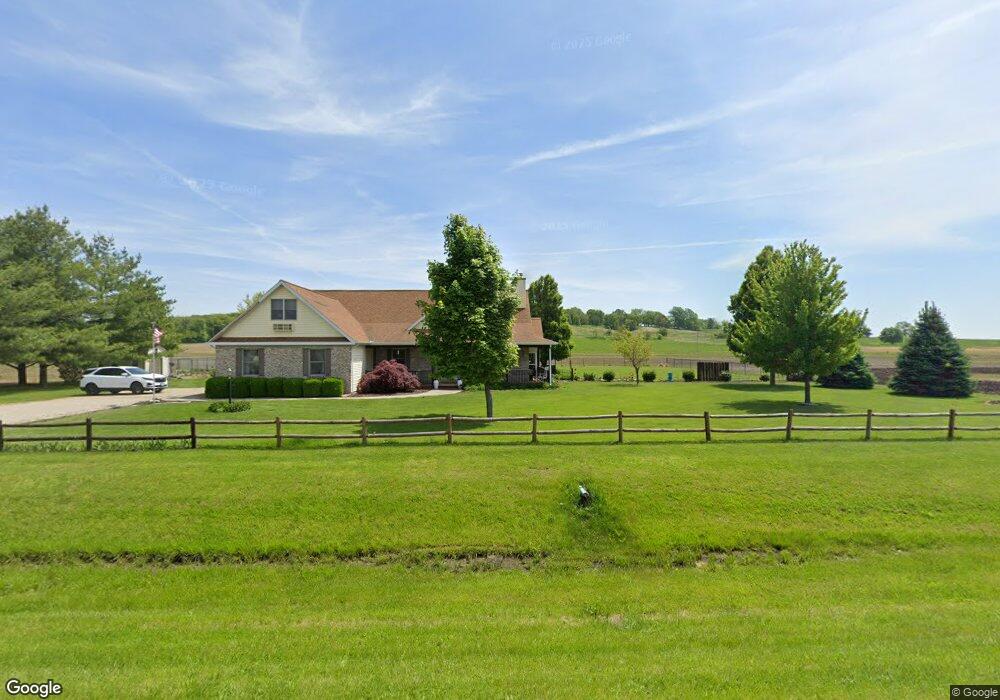
662 600th Ave Elkhart, IL 62634
Estimated Value: $254,000 - $283,000
3
Beds
2
Baths
2,150
Sq Ft
$126/Sq Ft
Est. Value
About This Home
This home is located at 662 600th Ave, Elkhart, IL 62634 and is currently estimated at $271,276, approximately $126 per square foot. 662 600th Ave is a home located in Logan County with nearby schools including Mount Pulaski Elementary School and Mount Pulaski High School.
Ownership History
Date
Name
Owned For
Owner Type
Purchase Details
Closed on
Dec 11, 2020
Sold by
Wilson John Robert
Bought by
Brown Richard L and Brown Judith A
Current Estimated Value
Home Financials for this Owner
Home Financials are based on the most recent Mortgage that was taken out on this home.
Original Mortgage
$80,000
Outstanding Balance
$4,271
Interest Rate
2.8%
Mortgage Type
New Conventional
Estimated Equity
$267,005
Purchase Details
Closed on
Jun 9, 2020
Sold by
Wilson John Robert and Wilson Sarah L
Bought by
Wilson John Robert
Purchase Details
Closed on
Dec 24, 2011
Sold by
Freeman Arthur J and Freeman Genda Sue
Bought by
Wilson John Robert and Wilson Sarah L
Home Financials for this Owner
Home Financials are based on the most recent Mortgage that was taken out on this home.
Original Mortgage
$172,900
Interest Rate
3.29%
Mortgage Type
Stand Alone First
Create a Home Valuation Report for This Property
The Home Valuation Report is an in-depth analysis detailing your home's value as well as a comparison with similar homes in the area
Home Values in the Area
Average Home Value in this Area
Purchase History
| Date | Buyer | Sale Price | Title Company |
|---|---|---|---|
| Brown Richard L | $21,500 | None Available | |
| Wilson John Robert | -- | None Available | |
| Wilson John Robert | $182,000 | -- |
Source: Public Records
Mortgage History
| Date | Status | Borrower | Loan Amount |
|---|---|---|---|
| Open | Brown Richard L | $80,000 | |
| Previous Owner | Wilson John Robert | $172,900 |
Source: Public Records
Tax History Compared to Growth
Tax History
| Year | Tax Paid | Tax Assessment Tax Assessment Total Assessment is a certain percentage of the fair market value that is determined by local assessors to be the total taxable value of land and additions on the property. | Land | Improvement |
|---|---|---|---|---|
| 2024 | $4,627 | $76,750 | $4,970 | $71,780 |
| 2023 | $4,251 | $70,740 | $4,580 | $66,160 |
| 2022 | $3,957 | $65,960 | $4,270 | $61,690 |
| 2021 | $3,840 | $63,430 | $4,110 | $59,320 |
| 2020 | $4,285 | $62,490 | $4,050 | $58,440 |
| 2019 | $4,273 | $61,570 | $3,990 | $57,580 |
| 2018 | $4,060 | $62,590 | $4,060 | $58,530 |
| 2017 | $4,063 | $62,590 | $4,060 | $58,530 |
| 2016 | $4,067 | $62,660 | $4,060 | $58,600 |
| 2015 | $3,291 | $53,560 | $3,520 | $50,040 |
| 2014 | $3,291 | $53,560 | $3,520 | $50,040 |
| 2013 | $3,291 | $50,520 | $3,320 | $47,200 |
| 2012 | $3,291 | $50,350 | $3,310 | $47,040 |
Source: Public Records
Map
Nearby Homes
- 104 E Stahl
- 101 S Bogardus St
- 301 N Gillett St
- 305 Kennedy Rd
- 0 Blue Stem Dr
- 14 Chicory Dr
- 13 Chicory Dr
- 11-12 Chicory Dr
- 3 Governor's Dr
- 0 Prairie Pointe Dr Unit RMACA1028503
- 0 Prairie Pointe Dr Unit RMACA1027909
- 7378 Lawn View Dr
- 0 E Main St
- 148 Hawthorne
- 117 Pulaski St
- 400 E Main St
- 227 Lester St
- 223 Lester St
- 215 Lester St
- 116 E Main St Unit 1
- 662 600th Ave
- 419 S Gillett St
- 654 600th Ave
- 417 S Gillett St
- 409 S Gillett St
- 405 S Gillett St
- 401 S Gillett St
- 420 S Bogardus St
- 408 S Bogardus St
- 410 S Bogardus St
- 313 S Gillett St
- 650 600th Ave
- 400 S Bogardus St
- 309 S Gillett St
- 419 S Bogardus St
- 316 S Bogardus St
- 413 S Bogardus St
- 312 S Bogardus St
- 401 S Bogardus St
- 301 S Gillett St