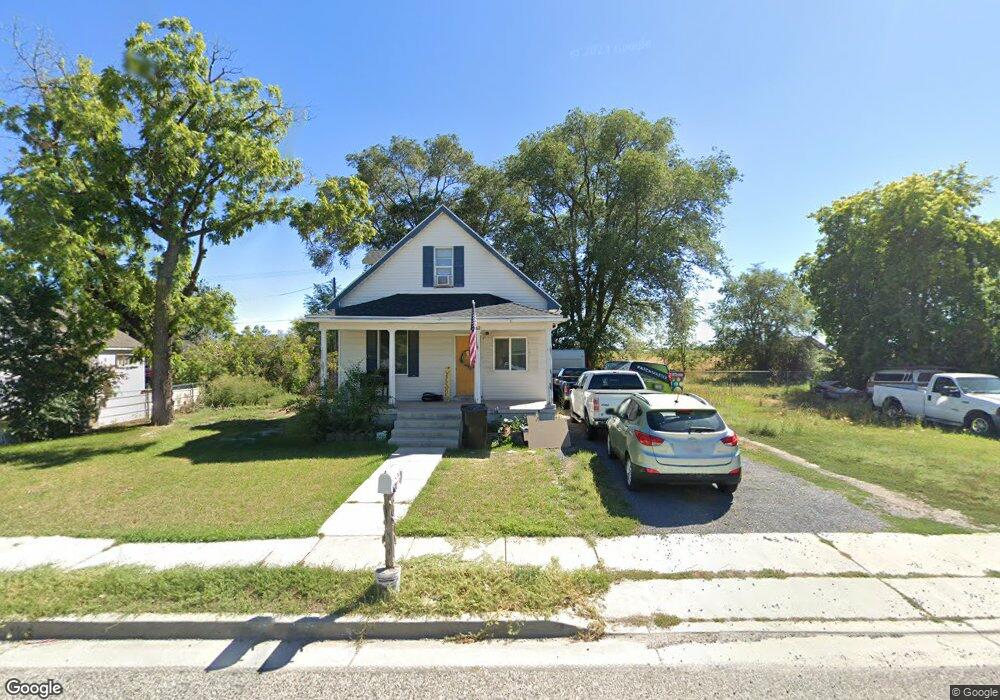
662 E Factory St Garland, UT 84312
Estimated Value: $289,000 - $347,000
2
Beds
1
Bath
1,466
Sq Ft
$211/Sq Ft
Est. Value
About This Home
This home is located at 662 E Factory St, Garland, UT 84312 and is currently estimated at $309,071, approximately $210 per square foot. 662 E Factory St is a home located in Box Elder County with nearby schools including Garland School, Bear River Middle School, and Alice C. Harris Intermediate School.
Ownership History
Date
Name
Owned For
Owner Type
Purchase Details
Closed on
Jul 10, 2024
Sold by
Phoenix Rye and Phoenix Lexi
Bought by
Allred Desmond Michael
Current Estimated Value
Home Financials for this Owner
Home Financials are based on the most recent Mortgage that was taken out on this home.
Original Mortgage
$323,232
Outstanding Balance
$319,401
Interest Rate
7.03%
Mortgage Type
New Conventional
Estimated Equity
-$10,330
Purchase Details
Closed on
Mar 23, 2022
Sold by
Misrasi Travis I
Bought by
Phoenix Rye and Phoenix Lexi
Home Financials for this Owner
Home Financials are based on the most recent Mortgage that was taken out on this home.
Original Mortgage
$223,100
Interest Rate
4.16%
Mortgage Type
New Conventional
Purchase Details
Closed on
Oct 30, 2007
Sold by
Irwin Thomas E and Israelsen Amie D
Bought by
Misrasi Travis J
Home Financials for this Owner
Home Financials are based on the most recent Mortgage that was taken out on this home.
Original Mortgage
$91,300
Interest Rate
6.35%
Mortgage Type
New Conventional
Create a Home Valuation Report for This Property
The Home Valuation Report is an in-depth analysis detailing your home's value as well as a comparison with similar homes in the area
Home Values in the Area
Average Home Value in this Area
Purchase History
| Date | Buyer | Sale Price | Title Company |
|---|---|---|---|
| Allred Desmond Michael | -- | Us Title | |
| Phoenix Rye | -- | Old Republic Title | |
| Misrasi Travis J | -- | Hickman Land Title Co |
Source: Public Records
Mortgage History
| Date | Status | Borrower | Loan Amount |
|---|---|---|---|
| Open | Allred Desmond Michael | $323,232 | |
| Previous Owner | Phoenix Rye | $223,100 | |
| Previous Owner | Misrasi Travis J | $91,300 |
Source: Public Records
Tax History Compared to Growth
Tax History
| Year | Tax Paid | Tax Assessment Tax Assessment Total Assessment is a certain percentage of the fair market value that is determined by local assessors to be the total taxable value of land and additions on the property. | Land | Improvement |
|---|---|---|---|---|
| 2025 | $1,241 | $219,940 | $105,000 | $114,940 |
| 2024 | $1,241 | $213,042 | $100,000 | $113,042 |
| 2023 | $1,239 | $209,820 | $90,000 | $119,820 |
| 2022 | $1,037 | $90,589 | $13,750 | $76,839 |
| 2021 | $853 | $103,212 | $25,000 | $78,212 |
| 2020 | $742 | $103,212 | $25,000 | $78,212 |
| 2019 | $703 | $51,818 | $13,750 | $38,068 |
| 2018 | $717 | $49,404 | $13,750 | $35,654 |
| 2017 | $745 | $89,825 | $13,750 | $64,825 |
| 2016 | $707 | $47,706 | $13,750 | $33,956 |
| 2015 | $669 | $44,619 | $13,750 | $30,869 |
| 2014 | $669 | $43,149 | $13,750 | $29,399 |
| 2013 | -- | $43,150 | $13,338 | $29,812 |
Source: Public Records
Map
Nearby Homes
- 686 E Factory St Unit 166
- 636 E Factory St
- 665 E Factory St Unit 97
- 612 E Factory St
- 716 E Factory St
- 675 E Factory St
- 663 E Factory St
- 631 E Factory St
- 740 E Factory St
- 605 E Factory St
- 713 E Factory St
- 586 E Factory St
- 739 E Factory St
- 587 E Factory St
- 786 E Factory St
- 562 E Factory St
- 779 E Factory St
- 563 E Factory St
- 522 E Factory St
- 797 E Factory St