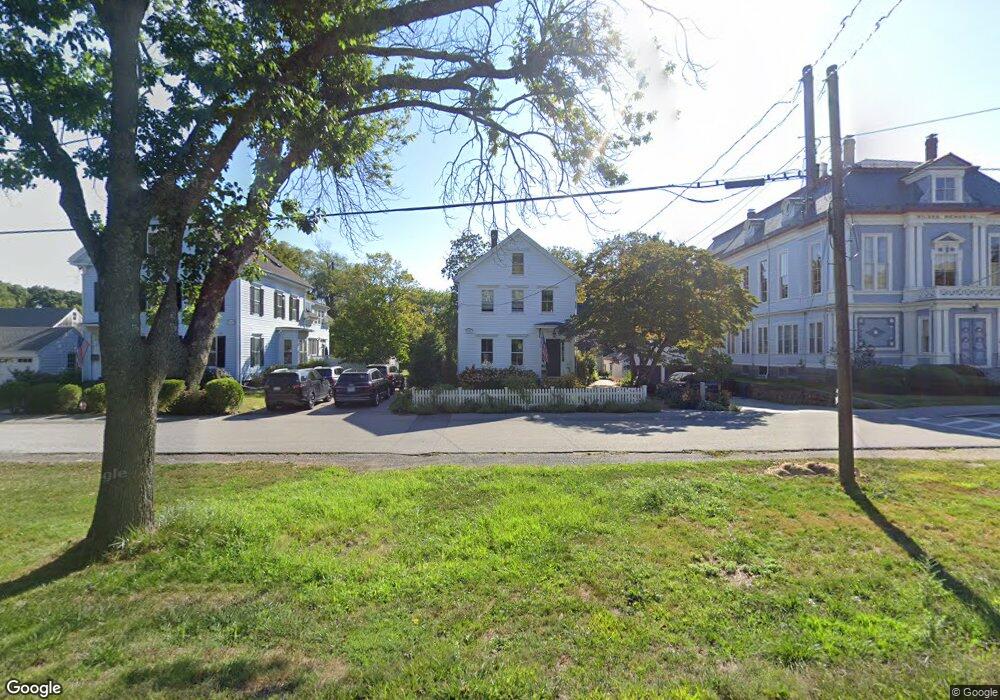
662 Main St Unit 1 Hingham, MA 02043
Estimated Value: $1,809,011 - $2,239,000
4
Beds
3
Baths
4,055
Sq Ft
$491/Sq Ft
Est. Value
About This Home
This home is located at 662 Main St Unit 1, Hingham, MA 02043 and is currently estimated at $1,989,253, approximately $490 per square foot. 662 Main St Unit 1 is a home located in Plymouth County with nearby schools including South Elementary School, Hingham Middle School, and Hingham High School.
Ownership History
Date
Name
Owned For
Owner Type
Purchase Details
Closed on
Jan 25, 2020
Sold by
Sawyer Kristina and Coleman Nathan
Bought by
Ellis Kevin and Ellis Sarah
Current Estimated Value
Home Financials for this Owner
Home Financials are based on the most recent Mortgage that was taken out on this home.
Original Mortgage
$960,000
Outstanding Balance
$848,032
Interest Rate
3.7%
Mortgage Type
Purchase Money Mortgage
Estimated Equity
$1,141,221
Purchase Details
Closed on
Sep 6, 2013
Sold by
Marjorie K Nicholson T
Bought by
Sawyer Kristina and Coleman Nathan
Home Financials for this Owner
Home Financials are based on the most recent Mortgage that was taken out on this home.
Original Mortgage
$651,000
Interest Rate
2%
Mortgage Type
Purchase Money Mortgage
Purchase Details
Closed on
Jun 4, 2012
Sold by
Nicholson Marjorie K
Bought by
Marjorie K Nicholson T and Coyle Marjorie A
Home Financials for this Owner
Home Financials are based on the most recent Mortgage that was taken out on this home.
Original Mortgage
$88,000
Interest Rate
3.9%
Mortgage Type
New Conventional
Create a Home Valuation Report for This Property
The Home Valuation Report is an in-depth analysis detailing your home's value as well as a comparison with similar homes in the area
Purchase History
| Date | Buyer | Sale Price | Title Company |
|---|---|---|---|
| Ellis Kevin | $1,200,000 | None Available | |
| Sawyer Kristina | $691,000 | -- | |
| Sawyer Kristina | $691,000 | -- | |
| Marjorie K Nicholson T | -- | -- |
Source: Public Records
Mortgage History
| Date | Status | Borrower | Loan Amount |
|---|---|---|---|
| Open | Ellis Kevin | $960,000 | |
| Previous Owner | Sawyer Kristina | $651,000 | |
| Previous Owner | Marjorie K Nicholson T | $88,000 |
Source: Public Records
Tax History
| Year | Tax Paid | Tax Assessment Tax Assessment Total Assessment is a certain percentage of the fair market value that is determined by local assessors to be the total taxable value of land and additions on the property. | Land | Improvement |
|---|---|---|---|---|
| 2025 | $14,978 | $1,401,100 | $703,200 | $697,900 |
| 2024 | $15,036 | $1,385,800 | $703,200 | $682,600 |
| 2023 | $13,643 | $1,364,300 | $703,200 | $661,100 |
| 2022 | $13,376 | $1,157,100 | $606,200 | $550,900 |
| 2021 | $13,401 | $1,135,700 | $606,200 | $529,500 |
| 2020 | $13,095 | $1,135,700 | $606,200 | $529,500 |
| 2019 | $7,303 | $1,126,400 | $606,200 | $520,200 |
| 2018 | $12,200 | $1,036,500 | $606,200 | $430,300 |
| 2017 | $11,059 | $902,800 | $606,200 | $296,600 |
| 2016 | $10,853 | $868,900 | $577,300 | $291,600 |
| 2015 | $8,409 | $671,100 | $568,200 | $102,900 |
Source: Public Records
Map
Nearby Homes
Your Personal Tour Guide
Ask me questions while you tour the home.