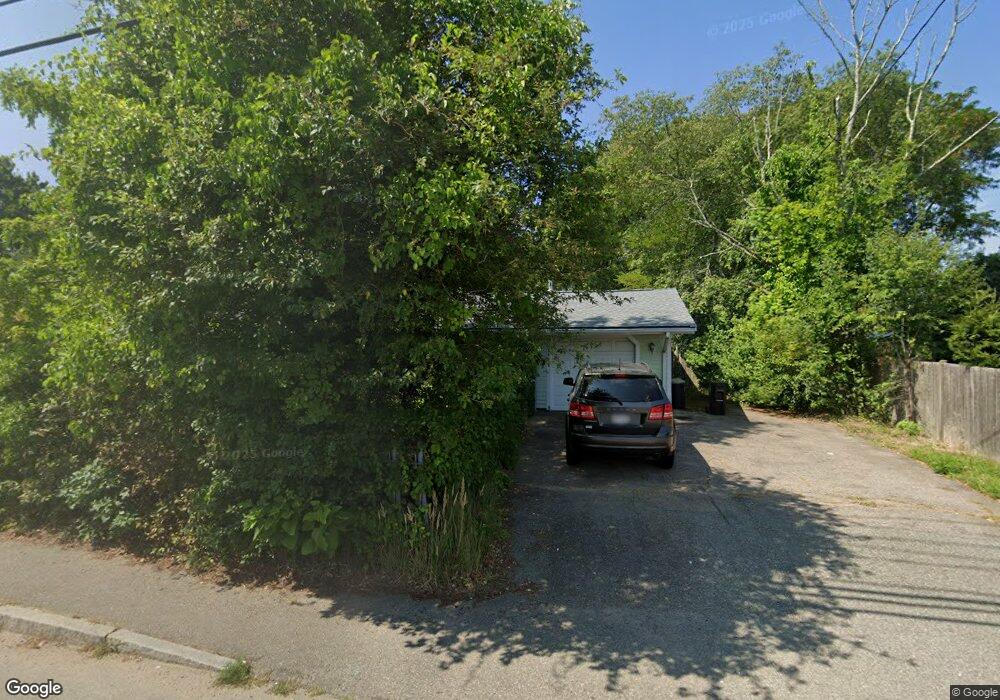
662 N Quincy St Brockton, MA 02302
Montello NeighborhoodEstimated Value: $402,000 - $457,000
3
Beds
1
Bath
864
Sq Ft
$506/Sq Ft
Est. Value
About This Home
This home is located at 662 N Quincy St, Brockton, MA 02302 and is currently estimated at $436,955, approximately $505 per square foot. 662 N Quincy St is a home located in Plymouth County with nearby schools including Brookfield Elementary School, Downey Elementary School, and Ashfield Middle School.
Ownership History
Date
Name
Owned For
Owner Type
Purchase Details
Closed on
Aug 21, 2009
Sold by
Department Of Housing & Urban Dev
Bought by
Haxhi Ardian
Current Estimated Value
Home Financials for this Owner
Home Financials are based on the most recent Mortgage that was taken out on this home.
Original Mortgage
$113,960
Interest Rate
5.19%
Mortgage Type
Purchase Money Mortgage
Purchase Details
Closed on
Feb 17, 2009
Sold by
Citimortgage Inc
Bought by
Department Of Housing & Urban Dev
Purchase Details
Closed on
Nov 4, 2008
Sold by
Daley Henry and Manoo Indrani
Bought by
Citimortgage Inc
Purchase Details
Closed on
Jul 29, 2004
Sold by
Goyette Charles D
Bought by
Manoo Indrani and Daley Henry
Home Financials for this Owner
Home Financials are based on the most recent Mortgage that was taken out on this home.
Original Mortgage
$224,477
Interest Rate
6.33%
Mortgage Type
Purchase Money Mortgage
Purchase Details
Closed on
Feb 11, 2004
Sold by
Zakhary Phyllis
Bought by
Goyette Charles D
Purchase Details
Closed on
Aug 2, 1993
Sold by
Phillips Eugene
Bought by
Goyette Charles D and Zakhary Phyllis
Create a Home Valuation Report for This Property
The Home Valuation Report is an in-depth analysis detailing your home's value as well as a comparison with similar homes in the area
Home Values in the Area
Average Home Value in this Area
Purchase History
| Date | Buyer | Sale Price | Title Company |
|---|---|---|---|
| Haxhi Ardian | $145,000 | -- | |
| Department Of Housing & Urban Dev | -- | -- | |
| Citimortgage Inc | $235,525 | -- | |
| Manoo Indrani | $228,000 | -- | |
| Goyette Charles D | -- | -- | |
| Goyette Charles D | $67,000 | -- |
Source: Public Records
Mortgage History
| Date | Status | Borrower | Loan Amount |
|---|---|---|---|
| Open | Goyette Charles D | $101,000 | |
| Closed | Goyette Charles D | $113,960 | |
| Previous Owner | Goyette Charles D | $224,477 |
Source: Public Records
Tax History Compared to Growth
Tax History
| Year | Tax Paid | Tax Assessment Tax Assessment Total Assessment is a certain percentage of the fair market value that is determined by local assessors to be the total taxable value of land and additions on the property. | Land | Improvement |
|---|---|---|---|---|
| 2025 | $4,333 | $357,800 | $148,900 | $208,900 |
| 2024 | $4,267 | $355,000 | $148,900 | $206,100 |
| 2023 | $4,420 | $340,500 | $114,200 | $226,300 |
| 2022 | $4,131 | $295,700 | $103,900 | $191,800 |
| 2021 | $3,960 | $273,100 | $97,500 | $175,600 |
| 2020 | $3,854 | $254,400 | $93,400 | $161,000 |
| 2019 | $3,649 | $234,800 | $87,500 | $147,300 |
| 2018 | $3,236 | $201,500 | $87,500 | $114,000 |
| 2017 | $2,912 | $180,900 | $87,500 | $93,400 |
| 2016 | $3,062 | $176,400 | $83,600 | $92,800 |
| 2015 | $2,556 | $140,800 | $83,600 | $57,200 |
| 2014 | $2,475 | $136,500 | $83,600 | $52,900 |
Source: Public Records
Map
Nearby Homes