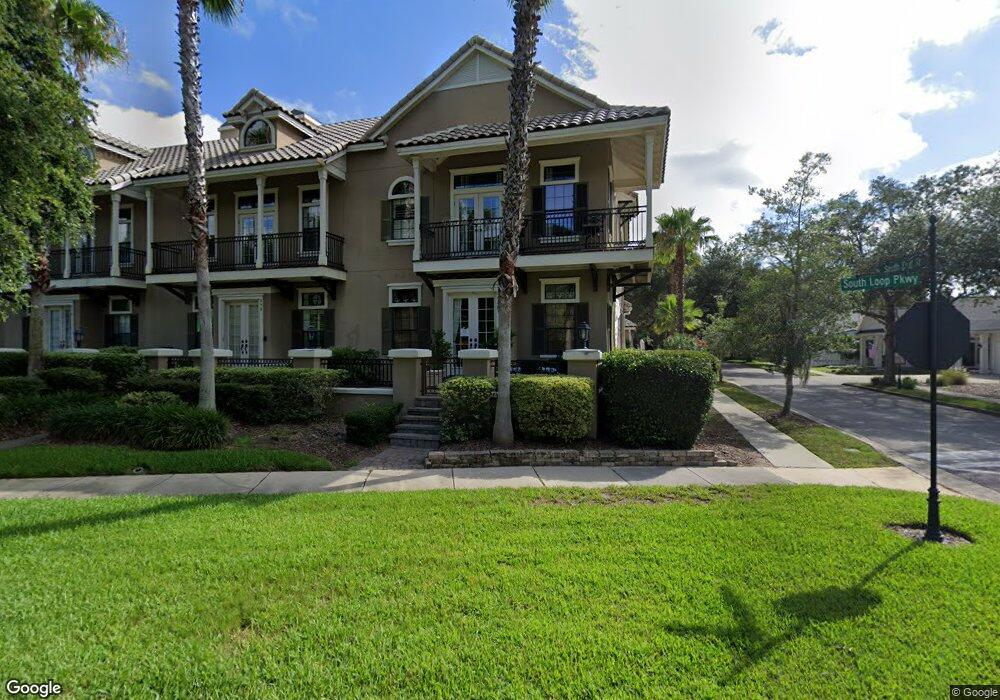
662 S Loop Pkwy Saint Augustine, FL 32095
Palencia NeighborhoodEstimated Value: $540,000 - $695,000
3
Beds
3
Baths
2,175
Sq Ft
$282/Sq Ft
Est. Value
About This Home
This home is located at 662 S Loop Pkwy, Saint Augustine, FL 32095 and is currently estimated at $612,932, approximately $281 per square foot. 662 S Loop Pkwy is a home located in St. Johns County with nearby schools including Palencia Elementary School, Pacetti Bay Middle School, and Allen D. Nease Senior High School.
Ownership History
Date
Name
Owned For
Owner Type
Purchase Details
Closed on
Apr 5, 2018
Sold by
Shuman Troy C and Shuman Amy M
Bought by
Ladenheim Jon H and Beers Sara Lynn
Current Estimated Value
Purchase Details
Closed on
Jul 20, 2011
Sold by
Hinson James D and Hinson Shirley A
Bought by
Shuman Troy C and Shuman Amy M
Home Financials for this Owner
Home Financials are based on the most recent Mortgage that was taken out on this home.
Original Mortgage
$204,676
Interest Rate
4.5%
Mortgage Type
FHA
Purchase Details
Closed on
Nov 14, 2005
Sold by
Harbormaster Holdings Llc
Bought by
Hinson James D and Hinson Shirley A
Purchase Details
Closed on
Jul 13, 2005
Sold by
Brylen Homes Ltd
Bought by
Harbourmaster Holdings Llc
Create a Home Valuation Report for This Property
The Home Valuation Report is an in-depth analysis detailing your home's value as well as a comparison with similar homes in the area
Home Values in the Area
Average Home Value in this Area
Purchase History
| Date | Buyer | Sale Price | Title Company |
|---|---|---|---|
| Ladenheim Jon H | $389,000 | Priority Natl Title Svcs Inc | |
| Shuman Troy C | $210,000 | Elite Title & Escrow | |
| Hinson James D | $524,900 | Stewart Title Guaranty Co | |
| Harbourmaster Holdings Llc | $456,700 | -- |
Source: Public Records
Mortgage History
| Date | Status | Borrower | Loan Amount |
|---|---|---|---|
| Previous Owner | Shuman Troy C | $204,676 |
Source: Public Records
Tax History
| Year | Tax Paid | Tax Assessment Tax Assessment Total Assessment is a certain percentage of the fair market value that is determined by local assessors to be the total taxable value of land and additions on the property. | Land | Improvement |
|---|---|---|---|---|
| 2025 | $8,396 | $504,289 | -- | -- |
| 2024 | $8,396 | $490,077 | $100,000 | $390,077 |
| 2023 | $8,396 | $480,164 | $100,000 | $380,164 |
| 2022 | $7,603 | $378,030 | $67,200 | $310,830 |
| 2021 | $7,245 | $331,140 | $0 | $0 |
| 2020 | $7,249 | $327,526 | $0 | $0 |
| 2019 | $7,022 | $300,282 | $0 | $0 |
| 2018 | $4,938 | $194,741 | $0 | $0 |
| 2017 | $4,858 | $190,736 | $0 | $0 |
| 2016 | $4,780 | $192,417 | $0 | $0 |
| 2015 | $4,735 | $191,079 | $0 | $0 |
| 2014 | $4,742 | $189,563 | $0 | $0 |
Source: Public Records
Map
Nearby Homes
- 654 S Loop Pkwy
- 400 Central St
- 630 Market St
- 554 Market St
- 744 S Loop Pkwy
- 620 Palencia Club Dr Unit 305
- 145 Spanish Marsh Dr
- 333 Stokes Creek Dr
- 168 Spanish Marsh Dr
- 213 Spanish Marsh Dr
- 216 Spanish Marsh Dr
- 205 Sophia Terrace
- 804 Cypress Crossing Trail
- 808 Cypress Crossing Trail
- 161 Augustine Island Way
- 709 Toria Ln Unit MUB3
- 713 Toria Ln
- 243 Front Door Ln
- 159 La Mesa Dr
- 1104 Westfield Way
Your Personal Tour Guide
Ask me questions while you tour the home.