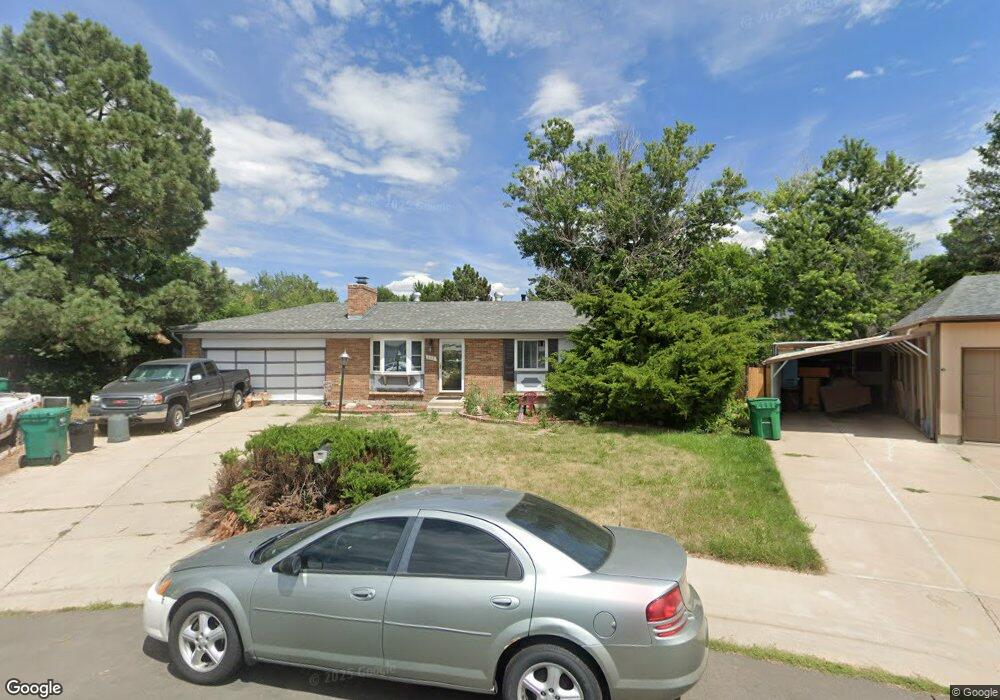
662 S Nile Way Aurora, CO 80012
Expo Park NeighborhoodEstimated Value: $401,000 - $466,000
3
Beds
3
Baths
912
Sq Ft
$481/Sq Ft
Est. Value
About This Home
This home is located at 662 S Nile Way, Aurora, CO 80012 and is currently estimated at $438,540, approximately $480 per square foot. 662 S Nile Way is a home located in Arapahoe County with nearby schools including Highline Community Elementary School, Prairie Middle School, and Overland High School.
Ownership History
Date
Name
Owned For
Owner Type
Purchase Details
Closed on
Feb 16, 2021
Sold by
Craig Daniel and Estate Of Maxine Rullo
Bought by
Craig Daniel
Current Estimated Value
Purchase Details
Closed on
Sep 30, 2020
Sold by
Craig David Dean and Estate Of David Craig
Bought by
Craig Daniel
Purchase Details
Closed on
May 24, 1995
Sold by
Hud
Bought by
Dean Rullo Wilma Maxine and Dean Craig David
Home Financials for this Owner
Home Financials are based on the most recent Mortgage that was taken out on this home.
Original Mortgage
$94,271
Interest Rate
8.34%
Mortgage Type
FHA
Purchase Details
Closed on
Dec 19, 1994
Sold by
Blood Mark W and Blood Sylvia J
Bought by
Hud
Purchase Details
Closed on
Jan 4, 1988
Sold by
Conversion Arapco
Bought by
Blood Mark W Blood Sylvia J
Purchase Details
Closed on
May 1, 1978
Sold by
Conversion Arapco
Bought by
Conversion Arapco
Purchase Details
Closed on
Jul 4, 1776
Bought by
Conversion Arapco
Create a Home Valuation Report for This Property
The Home Valuation Report is an in-depth analysis detailing your home's value as well as a comparison with similar homes in the area
Home Values in the Area
Average Home Value in this Area
Purchase History
| Date | Buyer | Sale Price | Title Company |
|---|---|---|---|
| Craig Daniel | -- | None Available | |
| Craig Daniel | -- | None Listed On Document | |
| Dean Rullo Wilma Maxine | -- | Stewart Title | |
| Hud | $82,299 | -- | |
| Blood Mark W Blood Sylvia J | -- | -- | |
| Conversion Arapco | -- | -- | |
| Conversion Arapco | -- | -- |
Source: Public Records
Mortgage History
| Date | Status | Borrower | Loan Amount |
|---|---|---|---|
| Previous Owner | Dean Rullo Wilma Maxine | $94,271 |
Source: Public Records
Tax History Compared to Growth
Tax History
| Year | Tax Paid | Tax Assessment Tax Assessment Total Assessment is a certain percentage of the fair market value that is determined by local assessors to be the total taxable value of land and additions on the property. | Land | Improvement |
|---|---|---|---|---|
| 2024 | $1,945 | $28,120 | -- | -- |
| 2023 | $1,945 | $28,120 | $0 | $0 |
| 2022 | $1,856 | $25,625 | $0 | $0 |
| 2021 | $1,868 | $25,625 | $0 | $0 |
| 2020 | $1,552 | $21,615 | $0 | $0 |
| 2019 | $1,498 | $21,615 | $0 | $0 |
| 2018 | $1,355 | $18,374 | $0 | $0 |
| 2017 | $1,335 | $18,374 | $0 | $0 |
| 2016 | $1,056 | $13,620 | $0 | $0 |
| 2015 | $1,004 | $13,620 | $0 | $0 |
| 2014 | -- | $9,345 | $0 | $0 |
| 2013 | -- | $11,190 | $0 | $0 |
Source: Public Records
Map
Nearby Homes
- 809 S Nome St
- 11621 E Ada Place
- 607 S Oswego Ct
- 841 S Oakland St
- 11623 E Virginia Dr
- 811 S Macon Way
- 906 S Moline St
- 11973 E Kepner Dr
- 11812 E Alaska Ave
- 12161 E Center Dr
- 11955 E Ford Dr
- 11996 E Kepner Dr
- 11759 E Alaska Ave
- 912 S Peoria St
- 11945 E Ford Dr
- 12055 E Tennessee Ave
- 932 S Peoria St Unit 932
- 11931 E Tennessee Ave
- 11911 E Tennessee Ave
- 12093 E Hoye Dr
- 652 S Nile Way
- 672 S Nile Way
- 663 S Nome St
- 673 S Nome St
- 11530 E Center Dr
- 11532 E Center Dr
- 653 S Nome St
- 683 S Nome St
- 682 S Nile Way
- 651 S Nile Way
- 647 S Nome St
- 11528 E Center Dr
- 661 S Nile Way
- 693 S Nome St
- 671 S Nile Way
- 11534 E Center Dr
- 11526 E Center Dr
- 692 S Nile Way
- 674 S Nome St
- 664 S Nome St