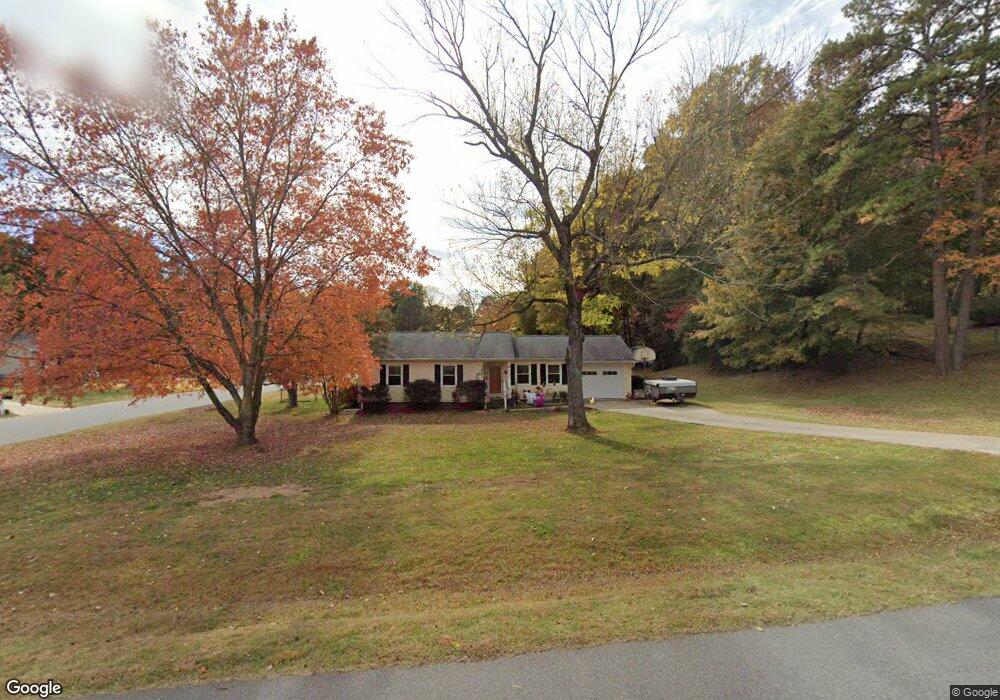
662 Sylvan St SW Concord, NC 28025
Estimated Value: $290,064 - $322,000
3
Beds
2
Baths
1,241
Sq Ft
$245/Sq Ft
Est. Value
About This Home
This home is located at 662 Sylvan St SW, Concord, NC 28025 and is currently estimated at $304,516, approximately $245 per square foot. 662 Sylvan St SW is a home located in Cabarrus County with nearby schools including R Brown Mcallister STEMElementary, Concord Middle School, and Concord High School.
Ownership History
Date
Name
Owned For
Owner Type
Purchase Details
Closed on
Mar 16, 2009
Sold by
Warren Tammy and Fertenbaugh Donald E
Bought by
Schnabel Erika C and Wertz Michael
Current Estimated Value
Home Financials for this Owner
Home Financials are based on the most recent Mortgage that was taken out on this home.
Original Mortgage
$127,546
Outstanding Balance
$81,145
Interest Rate
5.14%
Mortgage Type
FHA
Estimated Equity
$223,371
Purchase Details
Closed on
Dec 11, 1998
Sold by
Hammonds Robert E and Hammonds Catherine H
Bought by
Warren Tammy
Home Financials for this Owner
Home Financials are based on the most recent Mortgage that was taken out on this home.
Original Mortgage
$94,257
Interest Rate
6.84%
Mortgage Type
VA
Purchase Details
Closed on
Jul 1, 1987
Create a Home Valuation Report for This Property
The Home Valuation Report is an in-depth analysis detailing your home's value as well as a comparison with similar homes in the area
Home Values in the Area
Average Home Value in this Area
Purchase History
| Date | Buyer | Sale Price | Title Company |
|---|---|---|---|
| Schnabel Erika C | $130,000 | None Available | |
| Warren Tammy | $95,000 | -- | |
| -- | $63,500 | -- |
Source: Public Records
Mortgage History
| Date | Status | Borrower | Loan Amount |
|---|---|---|---|
| Open | Schnabel Erika C | $127,546 | |
| Previous Owner | Warren Tammy | $94,257 |
Source: Public Records
Tax History Compared to Growth
Tax History
| Year | Tax Paid | Tax Assessment Tax Assessment Total Assessment is a certain percentage of the fair market value that is determined by local assessors to be the total taxable value of land and additions on the property. | Land | Improvement |
|---|---|---|---|---|
| 2025 | $2,539 | $254,960 | $96,000 | $158,960 |
| 2024 | $2,539 | $254,960 | $96,000 | $158,960 |
| 2023 | $1,686 | $138,160 | $44,400 | $93,760 |
| 2022 | $1,673 | $137,140 | $44,400 | $92,740 |
| 2021 | $1,673 | $137,140 | $44,400 | $92,740 |
| 2020 | $1,673 | $137,140 | $44,400 | $92,740 |
| 2019 | $1,396 | $114,400 | $38,400 | $76,000 |
| 2018 | $1,373 | $114,400 | $38,400 | $76,000 |
| 2017 | $1,350 | $114,400 | $38,400 | $76,000 |
| 2016 | $801 | $111,110 | $38,400 | $72,710 |
| 2015 | $1,311 | $111,110 | $38,400 | $72,710 |
| 2014 | $1,311 | $111,110 | $38,400 | $72,710 |
Source: Public Records
Map
Nearby Homes
- 671 Sedgefield St SW
- 159 Fryling Ave SW
- 736 Spring St SW
- 80 Pounds Ave SW
- 111 Wilshire Ave SW
- 569 Union St S
- 571 Union St S
- 782 Union St S
- 23 Lawndale Ave SE
- 783 Union St S
- 309 Brightwood Ct SW
- 24 Doris Ct SE
- 85 Myrtle Ave SW
- 66 Arlington Ave SE
- 60 Patton Ct SE
- 269 Fryling Ave SW
- 00 Rollingwood Ln
- 34 Rollingwood Dr SE
- 522 Sunnyside Dr SE
- 745 Carolyn Dr SE
- 160 Obrien Place SW
- 658 Sylvan St SW
- 164 Obrien Place SW
- 663 Sylvan St SW
- 656 Sylvan St SW
- 656 Sylvan St SW Unit LT 20
- 165 Obrien Place SW
- 672 Sylvan St SW
- 181 Obrien Place SW
- 659 Sylvan St SW
- 654 Sylvan St SW
- 168 Obrien Place SW
- 191 Obrien Place SW
- 674 Sylvan St SW
- 673 Sylvan St SW
- 657 Sylvan St SW
- 195 Obrien Place SW
- 159 Marshdale Ave SW
- 632 Sylvan St SW
- 137 Marshdale Ave SW