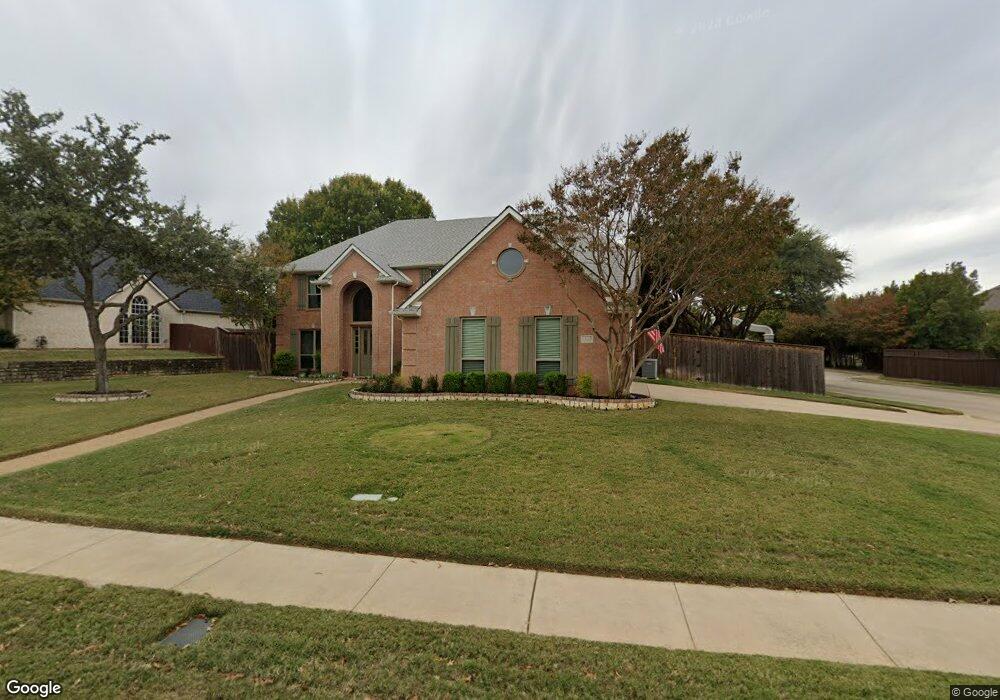
6620 Armstrong Ct Colleyville, TX 76034
Estimated Value: $886,846 - $996,000
4
Beds
4
Baths
3,736
Sq Ft
$249/Sq Ft
Est. Value
About This Home
This home is located at 6620 Armstrong Ct, Colleyville, TX 76034 and is currently estimated at $930,712, approximately $249 per square foot. 6620 Armstrong Ct is a home located in Tarrant County with nearby schools including Colleyville Elementary School, Cross Timbers Middle School, and Grapevine High School.
Ownership History
Date
Name
Owned For
Owner Type
Purchase Details
Closed on
Sep 23, 2016
Sold by
Neal Stephanie W
Bought by
Eakin Benjamin J and Mcdowell Katherine C
Current Estimated Value
Home Financials for this Owner
Home Financials are based on the most recent Mortgage that was taken out on this home.
Original Mortgage
$386,400
Outstanding Balance
$308,840
Interest Rate
3.45%
Mortgage Type
New Conventional
Estimated Equity
$621,872
Purchase Details
Closed on
Nov 20, 2013
Sold by
Neal Christopher A
Bought by
Neal Stephanie W
Home Financials for this Owner
Home Financials are based on the most recent Mortgage that was taken out on this home.
Original Mortgage
$244,900
Interest Rate
3.62%
Mortgage Type
Purchase Money Mortgage
Purchase Details
Closed on
Dec 28, 2001
Sold by
Pulte Homes Of Texas Lp
Bought by
Neal Christopher A
Home Financials for this Owner
Home Financials are based on the most recent Mortgage that was taken out on this home.
Original Mortgage
$241,137
Interest Rate
7.03%
Create a Home Valuation Report for This Property
The Home Valuation Report is an in-depth analysis detailing your home's value as well as a comparison with similar homes in the area
Home Values in the Area
Average Home Value in this Area
Purchase History
| Date | Buyer | Sale Price | Title Company |
|---|---|---|---|
| Eakin Benjamin J | -- | Fair Texas Title | |
| Neal Stephanie W | -- | Attorney | |
| Neal Christopher A | -- | First American Title Ins Co |
Source: Public Records
Mortgage History
| Date | Status | Borrower | Loan Amount |
|---|---|---|---|
| Open | Eakin Benjamin J | $386,400 | |
| Previous Owner | Neal Stephanie W | $244,900 | |
| Previous Owner | Neal Christopher A | $241,137 |
Source: Public Records
Tax History Compared to Growth
Tax History
| Year | Tax Paid | Tax Assessment Tax Assessment Total Assessment is a certain percentage of the fair market value that is determined by local assessors to be the total taxable value of land and additions on the property. | Land | Improvement |
|---|---|---|---|---|
| 2025 | $2,618 | $901,166 | $260,610 | $640,556 |
| 2024 | $2,618 | $813,253 | $186,150 | $627,103 |
| 2023 | $9,861 | $754,894 | $186,150 | $568,744 |
| 2022 | $10,496 | $531,438 | $186,150 | $345,288 |
| 2021 | $11,534 | $525,211 | $111,690 | $413,521 |
| 2020 | $11,715 | $527,184 | $111,690 | $415,494 |
| 2019 | $11,964 | $517,467 | $100,000 | $417,467 |
| 2018 | $2,917 | $490,738 | $100,000 | $390,738 |
| 2017 | $11,268 | $476,976 | $100,000 | $376,976 |
| 2016 | $10,659 | $451,181 | $100,000 | $351,181 |
| 2015 | $9,474 | $408,800 | $65,000 | $343,800 |
| 2014 | $9,474 | $408,800 | $65,000 | $343,800 |
Source: Public Records
Map
Nearby Homes
- 6805 Shalimar Ct
- 7000 Shalimar Ct
- 7012 Shepherds Glen
- 7200 Belle Meade Dr
- 7106 Belle Meade Dr
- 1509 Tinker Rd
- TBD - Lot 3 John Mccain Rd
- TBD - Lot 1 John Mccain Rd
- 1315 Hardage Ln
- 7255 Oak Alley Dr
- 6900 Sir Spencer Ct
- 7322 Calloway Ct
- 7316 Calloway Ct
- 1417 Nottoway Ct
- 1418 Nottoway Ct
- 1406 Nottoway Ct
- 2008 Kyle Ct
- 7312 Hix Ct
- 7001 Colleyville Blvd
- 6005 Valentino Ct
- 6616 Armstrong Ct
- 6700 Armstrong Ct
- 6601 Sapphire Cir S
- 1401 Tennison Pkwy
- 6612 Armstrong Ct
- 6733 Sapphire Cir N
- 1400 Douglas Ave
- 1400 Tennison Pkwy
- 6605 Sapphire Cir S
- 6608 Armstrong Ct
- 1404 Tennison Pkwy
- 1405 Tennison Pkwy
- 6706 Armstrong Ct
- 6729 Sapphire Cir N
- 6730 Sapphire Cir N
- 1401 Douglas Ave
- 6607 Sapphire Cir S
- 6604 Sapphire Cir S
- 1408 Tennison Pkwy
- 6604 Armstrong Ct