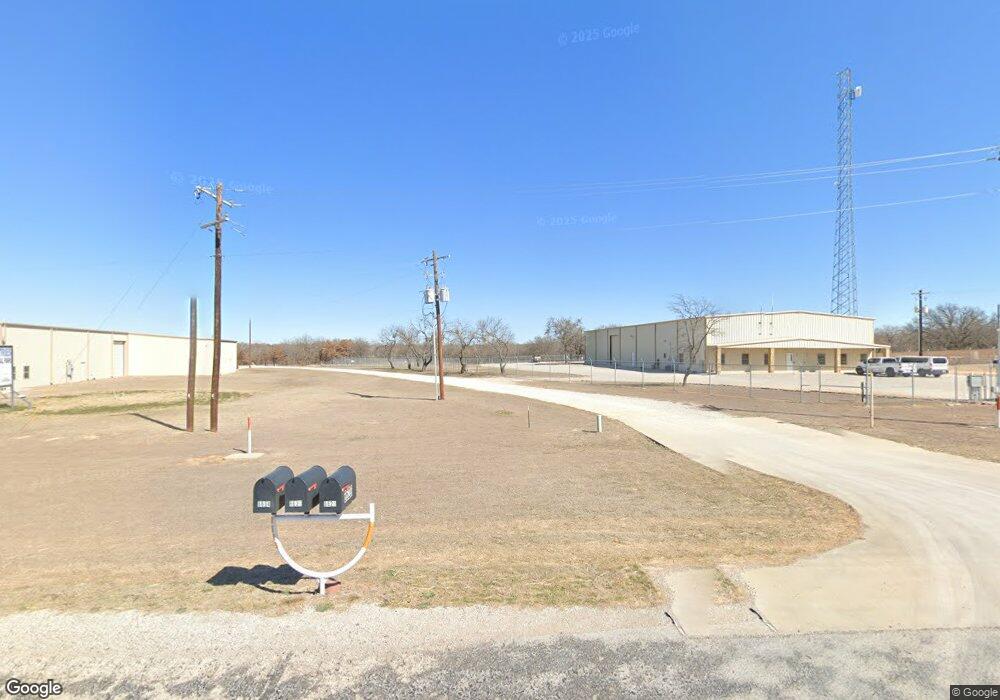
6620 Mineral Wells Hwy Weatherford, TX 76088
--
Bed
--
Bath
6,000
Sq Ft
2
Acres
About This Home
This home is located at 6620 Mineral Wells Hwy, Weatherford, TX 76088. 6620 Mineral Wells Hwy is a home located in Parker County with nearby schools including Millsap Elementary School, Millsap Middle School, and Millsap High School.
Ownership History
Date
Name
Owned For
Owner Type
Purchase Details
Closed on
May 16, 2025
Sold by
Texas Bank
Bought by
Anchor Group Investments Llc
Purchase Details
Closed on
Oct 31, 2013
Sold by
Angona Richard
Bought by
A & J Industries Inc
Home Financials for this Owner
Home Financials are based on the most recent Mortgage that was taken out on this home.
Original Mortgage
$268,000
Interest Rate
4.56%
Mortgage Type
Commercial
Purchase Details
Closed on
Jun 20, 2007
Sold by
Angona Richard W
Bought by
A & J Industries Inc
Home Financials for this Owner
Home Financials are based on the most recent Mortgage that was taken out on this home.
Original Mortgage
$110,000
Interest Rate
6.41%
Mortgage Type
Seller Take Back
Purchase Details
Closed on
Apr 1, 1991
Bought by
A & J Industries Inc
Create a Home Valuation Report for This Property
The Home Valuation Report is an in-depth analysis detailing your home's value as well as a comparison with similar homes in the area
Home Values in the Area
Average Home Value in this Area
Purchase History
| Date | Buyer | Sale Price | Title Company |
|---|---|---|---|
| Anchor Group Investments Llc | -- | None Listed On Document | |
| A & J Industries Inc | -- | Lawyers Title | |
| A & J Industries Inc | -- | -- | |
| Angona Richard | -- | None Available | |
| A & J Industries Inc | -- | -- |
Source: Public Records
Mortgage History
| Date | Status | Borrower | Loan Amount |
|---|---|---|---|
| Previous Owner | A & J Industries Inc | $268,000 | |
| Previous Owner | Angona Richard | $110,000 |
Source: Public Records
Tax History Compared to Growth
Tax History
| Year | Tax Paid | Tax Assessment Tax Assessment Total Assessment is a certain percentage of the fair market value that is determined by local assessors to be the total taxable value of land and additions on the property. | Land | Improvement |
|---|---|---|---|---|
| 2025 | $14,949 | $1,208,830 | $258,800 | $950,030 |
| 2024 | $14,949 | $898,560 | $225,960 | $672,600 |
| 2023 | $14,949 | $898,560 | $225,960 | $672,600 |
| 2022 | $12,714 | $670,090 | $145,710 | $524,380 |
| 2021 | $13,942 | $670,090 | $145,710 | $524,380 |
| 2020 | $12,810 | $595,390 | $82,750 | $512,640 |
| 2019 | $13,736 | $595,390 | $82,750 | $512,640 |
| 2018 | $11,232 | $481,430 | $74,510 | $406,920 |
| 2017 | $11,630 | $481,430 | $74,510 | $406,920 |
| 2016 | $11,470 | $474,820 | $68,670 | $406,150 |
| 2015 | $11,330 | $474,820 | $68,670 | $406,150 |
| 2014 | $6,569 | $274,350 | $83,120 | $191,230 |
Source: Public Records
Map
Nearby Homes
- 144 Graystone Dr
- 222 Fox Rd
- 117 Graystone Dr
- 3900 Hott Ln
- 3736 Hott Ln
- 1000 Lambert Ct
- 1012 Lambert Ct
- 3696 W Lambert Rd
- 0000 Mineral Wells Hwy
- 800 Fox Rd
- 1001 W Lambert Ct
- 112 Bruce Crandall Ct
- 1027 Oak Bend Ln
- 1019 Oak Bend Ln
- 124 Mike Thornton Ct
- 5878 Greenwood Rd
- 4710 Mineral Wells Hwy
- TBD Old Mineral Wells Hwy
- 103 Saddle Club Rd
- 4204 Greenwood Rd
- 6630 Mineral Wells Hwy
- TBD-81 Mineral Wells Hwy
- TBD-38 Mineral Wells Hwy
- 6704 Mineral Wells Hwy
- 6582 Mineral Wells Hwy
- 6582 Mineral Wells Hwy
- 6728 Mineral Wells Hwy
- 179 Graystone Dr
- 6436 Mineral Wells Hwy
- 160 Graystone Dr
- 152 Fox Rd
- 152 Fox Rd Unit Weatherford
- 305 Graystone Dr
- 304 Ravestone Ct
- 305b Ravestone Ct
- 0 Mccarthy Dr
- 6430 Mineral Wells Hwy
- 195 Graystone
- 300 Graystone Dr
- 304 Graystone Dr