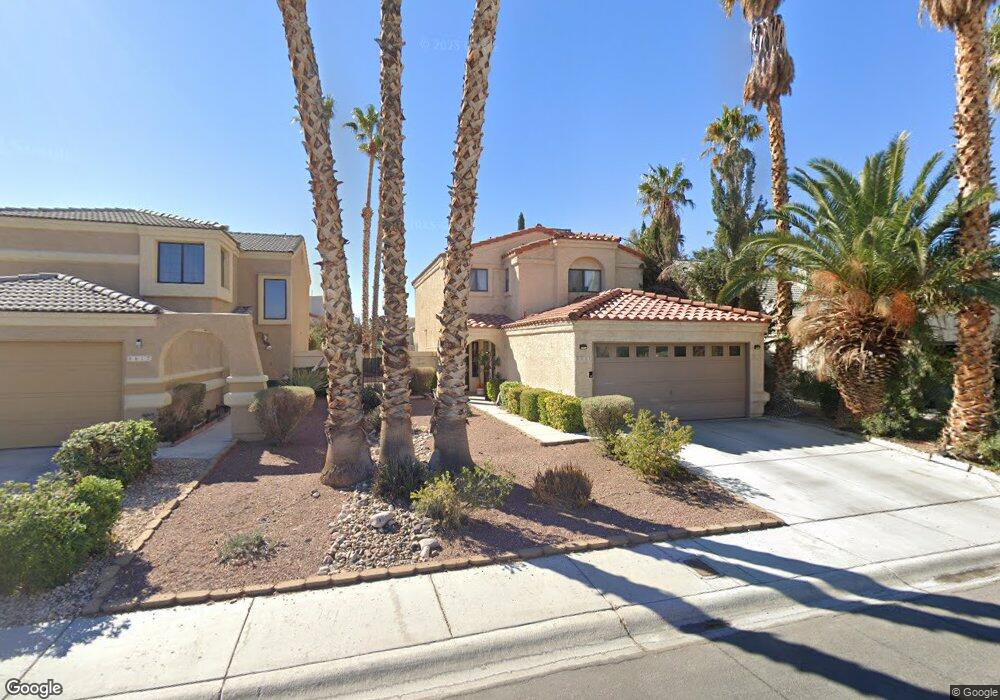
6621 Canyon Cove Way Las Vegas, NV 89108
Woodcrest NeighborhoodEstimated Value: $378,914 - $425,000
3
Beds
3
Baths
1,583
Sq Ft
$250/Sq Ft
Est. Value
About This Home
This home is located at 6621 Canyon Cove Way, Las Vegas, NV 89108 and is currently estimated at $395,229, approximately $249 per square foot. 6621 Canyon Cove Way is a home located in Clark County with nearby schools including R.E. Tobler Elementary School, Irwin & Susan Molasky Junior High School, and Cheyenne High School.
Ownership History
Date
Name
Owned For
Owner Type
Purchase Details
Closed on
Feb 21, 1999
Sold by
Smith Sherry L and Grobe Susan
Bought by
Frisch Ronald W and Frisch Therese A
Current Estimated Value
Home Financials for this Owner
Home Financials are based on the most recent Mortgage that was taken out on this home.
Original Mortgage
$116,043
Interest Rate
6.7%
Mortgage Type
FHA
Purchase Details
Closed on
May 13, 1997
Sold by
Mcadams Joseph E and Mcadams Ok Im
Bought by
Smith Sherry L and Grube Susan
Home Financials for this Owner
Home Financials are based on the most recent Mortgage that was taken out on this home.
Original Mortgage
$94,700
Interest Rate
7.98%
Purchase Details
Closed on
Mar 28, 1997
Sold by
State Streets Properties Inc
Bought by
Mcadams Joseph E and Mcadams Im Ok
Home Financials for this Owner
Home Financials are based on the most recent Mortgage that was taken out on this home.
Original Mortgage
$94,700
Interest Rate
7.98%
Create a Home Valuation Report for This Property
The Home Valuation Report is an in-depth analysis detailing your home's value as well as a comparison with similar homes in the area
Home Values in the Area
Average Home Value in this Area
Purchase History
| Date | Buyer | Sale Price | Title Company |
|---|---|---|---|
| Frisch Ronald W | $117,000 | Old Republic Title Company | |
| Smith Sherry L | $118,500 | Land Title | |
| Mcadams Joseph E | $25,000 | Nevada Title Company |
Source: Public Records
Mortgage History
| Date | Status | Borrower | Loan Amount |
|---|---|---|---|
| Open | Frisch Therese A | $588,000 | |
| Closed | Frisch Therese A | $588,000 | |
| Previous Owner | Frisch Ronald W | $131,000 | |
| Previous Owner | Frisch Ronald W | $70,000 | |
| Previous Owner | Frisch Ronald W | $150,000 | |
| Previous Owner | Frisch Ronald W | $30,000 | |
| Previous Owner | Frisch Ronald W | $114,949 | |
| Previous Owner | Frisch Ronald W | $116,043 | |
| Previous Owner | Smith Sherry L | $94,700 |
Source: Public Records
Tax History Compared to Growth
Tax History
| Year | Tax Paid | Tax Assessment Tax Assessment Total Assessment is a certain percentage of the fair market value that is determined by local assessors to be the total taxable value of land and additions on the property. | Land | Improvement |
|---|---|---|---|---|
| 2025 | $1,259 | $69,472 | $27,300 | $42,172 |
| 2024 | $1,222 | $69,472 | $27,300 | $42,172 |
| 2023 | $1,222 | $70,976 | $30,100 | $40,876 |
| 2022 | $1,187 | $61,450 | $23,800 | $37,650 |
| 2021 | $1,152 | $57,201 | $21,000 | $36,201 |
| 2020 | $1,116 | $56,499 | $20,300 | $36,199 |
| 2019 | $1,102 | $52,374 | $16,450 | $35,924 |
| 2018 | $1,052 | $49,464 | $14,700 | $34,764 |
| 2017 | $1,588 | $48,436 | $12,950 | $35,486 |
| 2016 | $986 | $45,066 | $9,100 | $35,966 |
| 2015 | $983 | $39,071 | $6,930 | $32,141 |
| 2014 | $954 | $28,233 | $5,775 | $22,458 |
Source: Public Records
Map
Nearby Homes
- 6617 Beacon Rd
- 3948 Cobble Creek Ct
- 3909 Rhine Way Unit 2
- 6645 Telegraph Rd
- 3805 Twig Ln
- 3948 Applecrest St
- 6465 Plumcrest Rd
- 3813 Marshall Cir
- 6656 Joe Michael Way
- 6660 Joe Michael Way
- 6429 Roy Rogers Dr Unit 2
- 3740 Broadriver Dr
- 6920 Senton Ave
- 6800 Dorita Ave Unit 202
- 6700 Amarinta Ave Unit 103
- 3621 Broxburn St
- 6604 Chardonay Way
- 4052 Cape Sand Dr
- 3609 Pintadas St Unit 202
- 3757 N Torrey Pines Dr
- 6617 Canyon Cove Way Unit 1
- 6617 Canyon Cove Way
- 6625 Canyon Cove Way
- 6613 Canyon Cove Way
- 6629 Canyon Cove Way
- 6629 Canyon Cove Way Unit None
- 6624 Beacon Rd
- 6620 Beacon Rd
- 6628 Beacon Rd
- 6633 Canyon Cove Way
- 3928 Cobble Creek Ct
- 6609 Canyon Cove Way
- 6616 Beacon Rd
- 6632 Beacon Rd
- 6612 Beacon Rd
- 6636 Beacon Rd
- 3932 Cobble Creek Ct
- 6605 Canyon Cove Way
- 6605 Canyon Cove Way
- 6637 Canyon Cove Way