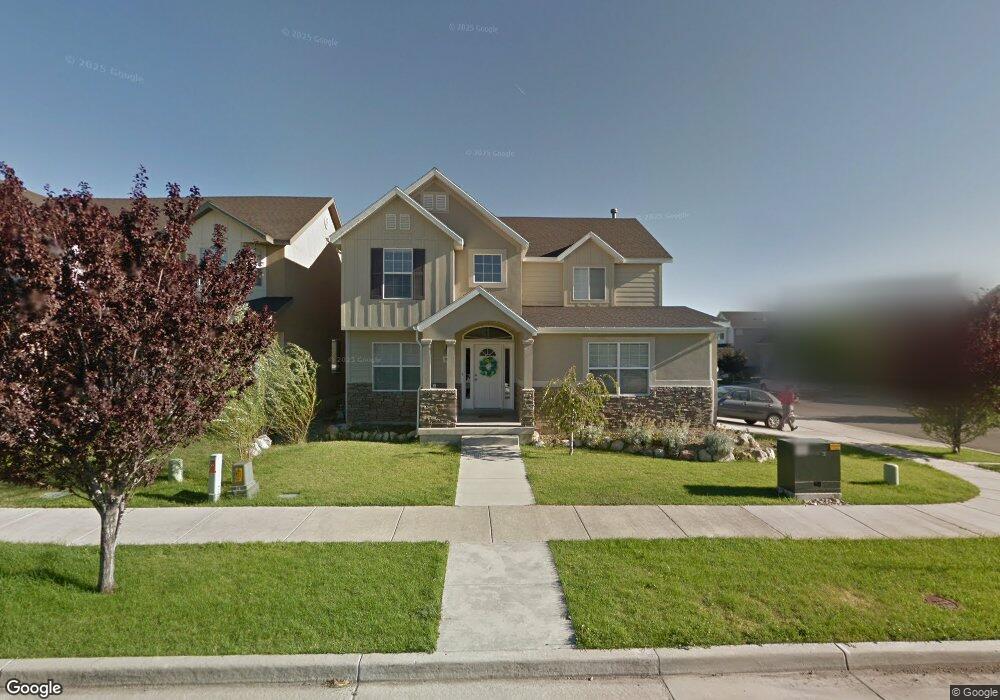
6623 W Bridge Maple Ln West Jordan, UT 84081
Jordan Hills NeighborhoodEstimated Value: $541,334 - $576,000
4
Beds
3
Baths
3,014
Sq Ft
$187/Sq Ft
Est. Value
About This Home
This home is located at 6623 W Bridge Maple Ln, West Jordan, UT 84081 and is currently estimated at $562,584, approximately $186 per square foot. 6623 W Bridge Maple Ln is a home located in Salt Lake County with nearby schools including Fox Hollow School, Sunset Ridge Middle School, and Copper Hills High School.
Ownership History
Date
Name
Owned For
Owner Type
Purchase Details
Closed on
May 14, 2009
Sold by
Vega Bernadino L
Bought by
Woodard Welch Tammey S
Current Estimated Value
Home Financials for this Owner
Home Financials are based on the most recent Mortgage that was taken out on this home.
Original Mortgage
$235,554
Outstanding Balance
$148,427
Interest Rate
4.8%
Mortgage Type
FHA
Estimated Equity
$414,157
Purchase Details
Closed on
Aug 10, 2006
Sold by
Wilde Kody Christopher and Wilde Alanna
Bought by
Vega Bernadino L
Home Financials for this Owner
Home Financials are based on the most recent Mortgage that was taken out on this home.
Original Mortgage
$208,500
Interest Rate
6.7%
Mortgage Type
Purchase Money Mortgage
Purchase Details
Closed on
Jul 21, 2005
Sold by
Wilde Kody Christopher
Bought by
Wilde Kody Christopher and Wilde Alanna
Purchase Details
Closed on
Jun 2, 2004
Sold by
Salisbury Development Lc
Bought by
Wilde Kody C
Home Financials for this Owner
Home Financials are based on the most recent Mortgage that was taken out on this home.
Original Mortgage
$169,047
Interest Rate
5.99%
Mortgage Type
FHA
Create a Home Valuation Report for This Property
The Home Valuation Report is an in-depth analysis detailing your home's value as well as a comparison with similar homes in the area
Home Values in the Area
Average Home Value in this Area
Purchase History
| Date | Buyer | Sale Price | Title Company |
|---|---|---|---|
| Woodard Welch Tammey S | -- | Bonneville Superior Title | |
| Vega Bernadino L | -- | Bonneville Superior Title | |
| Wilde Kody Christopher | -- | Title One | |
| Wilde Kody Christopher | -- | Title One | |
| Wilde Kody C | -- | Provo Land Title Company |
Source: Public Records
Mortgage History
| Date | Status | Borrower | Loan Amount |
|---|---|---|---|
| Open | Woodard Welch Tammey S | $235,554 | |
| Previous Owner | Vega Bernadino L | $208,500 | |
| Previous Owner | Wilde Kody C | $169,047 |
Source: Public Records
Tax History Compared to Growth
Tax History
| Year | Tax Paid | Tax Assessment Tax Assessment Total Assessment is a certain percentage of the fair market value that is determined by local assessors to be the total taxable value of land and additions on the property. | Land | Improvement |
|---|---|---|---|---|
| 2025 | $2,697 | $499,300 | $123,800 | $375,500 |
| 2024 | $2,697 | $474,800 | $119,000 | $355,800 |
| 2023 | $2,714 | $449,300 | $114,500 | $334,800 |
| 2022 | $2,848 | $468,600 | $112,300 | $356,300 |
| 2021 | $2,496 | $379,800 | $86,400 | $293,400 |
| 2020 | $2,373 | $337,900 | $80,100 | $257,800 |
| 2019 | $2,322 | $323,900 | $75,600 | $248,300 |
| 2018 | $2,176 | $300,100 | $75,600 | $224,500 |
| 2017 | $2,078 | $283,600 | $75,600 | $208,000 |
| 2016 | $2,153 | $276,300 | $69,900 | $206,400 |
| 2015 | $1,856 | $230,600 | $75,200 | $155,400 |
| 2014 | $1,807 | $220,700 | $72,900 | $147,800 |
Source: Public Records
Map
Nearby Homes
- 6777 Grevillea Ln
- 7474 S Sunset Maple Dr
- 6412 W Chan Reese Dr
- 6463 W Maple Valley Cir Unit 1030
- 6793 Tupelo Ln
- 7613 Oak Hallow Rd Unit 325
- 6934 Pointe Cedar Ln Unit 330
- 6938 Pointe Cedar Ln Unit 331
- 6593 W 7870 S
- 6977 Farnsworth Peak Dr Unit 311
- 6602 W Braeburn Way
- Accord Plan at Orchard Heights
- Interlude Plan at Orchard Heights
- Octave Plan at Orchard Heights
- Treble Plan at Orchard Heights
- Princeton Plan at Orchard Heights
- Adagio Plan at Orchard Heights
- Forte Plan at Orchard Heights
- Tempo Plan at Orchard Heights
- Concerto Plan at Orchard Heights
- 6623 Bridge Maple Ln
- 6613 Bridge Maple Ln
- 7507 S Mesa Maple Dr
- 7507 Mesa Maple Dr
- 6601 Bridge Maple Ln
- 7477 S Mesa Maple Dr
- 7477 Mesa Maple Dr
- 7517 Mesa Maple Dr
- 7492 Mesa Maple Dr
- 7492 S Mesa Maple Dr
- 7498 Mesa Maple Dr
- 7484 S Mesa Maple Dr
- 7484 Mesa Maple Dr
- 7508 Mesa Maple Dr
- 7508 S Mesa Maple Dr
- 7474 Brook Maple Way
- 7474 S Brook Maple Way
- 6597 Bridge Maple Ln
- 7469 Mesa Maple Dr
- 7478 Mesa Maple Dr