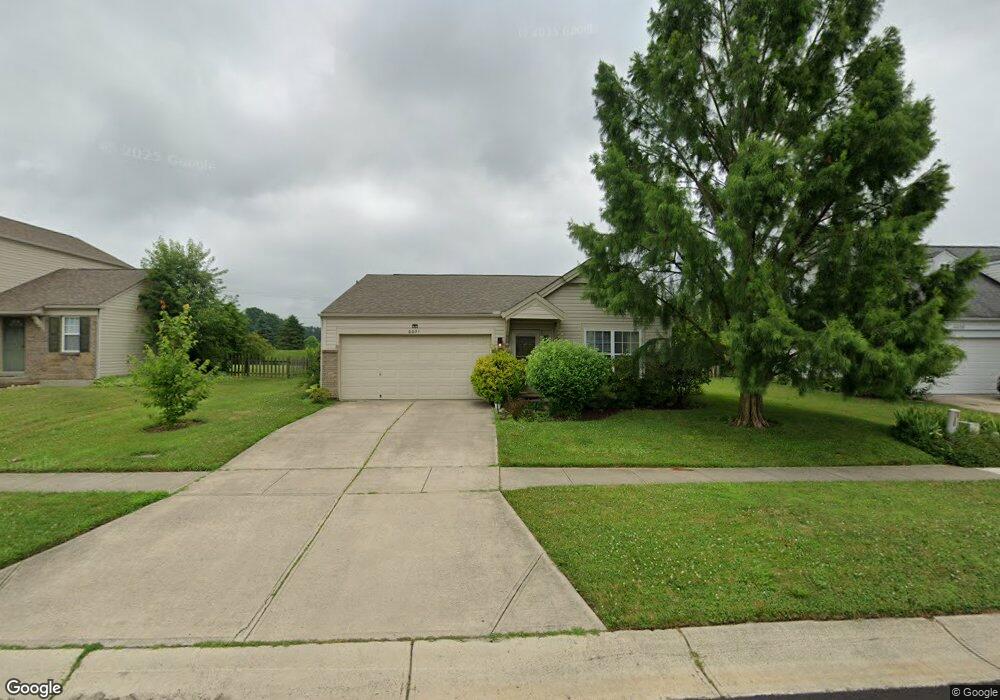
6624 Abingdon Hall Morrow, OH 45152
Estimated Value: $272,327 - $293,000
3
Beds
2
Baths
1,168
Sq Ft
$242/Sq Ft
Est. Value
About This Home
This home is located at 6624 Abingdon Hall, Morrow, OH 45152 and is currently estimated at $282,832, approximately $242 per square foot. 6624 Abingdon Hall is a home located in Warren County with nearby schools including Little Miami Early Childhood Center, Little Miami Intermediate Middle School, and Little Miami Middle School.
Ownership History
Date
Name
Owned For
Owner Type
Purchase Details
Closed on
Nov 20, 2020
Sold by
Tomlinson John A and Tomlinson Regina M
Bought by
Gibson Roger and Burnette Kathy
Current Estimated Value
Purchase Details
Closed on
Nov 29, 2007
Sold by
Hud
Bought by
Tomlinson John A
Home Financials for this Owner
Home Financials are based on the most recent Mortgage that was taken out on this home.
Original Mortgage
$95,320
Interest Rate
6.31%
Mortgage Type
Purchase Money Mortgage
Purchase Details
Closed on
Jan 2, 2007
Sold by
Anderson Glen E and Wells Fargo Bank Na
Bought by
Hud
Purchase Details
Closed on
Feb 9, 2004
Sold by
Maple Street Homes Llc
Bought by
Anderson Glen E
Home Financials for this Owner
Home Financials are based on the most recent Mortgage that was taken out on this home.
Original Mortgage
$132,937
Interest Rate
5.96%
Mortgage Type
FHA
Purchase Details
Closed on
Sep 26, 2003
Sold by
Grand Communities Ltd
Bought by
Maple Street Homes Llc
Create a Home Valuation Report for This Property
The Home Valuation Report is an in-depth analysis detailing your home's value as well as a comparison with similar homes in the area
Home Values in the Area
Average Home Value in this Area
Purchase History
| Date | Buyer | Sale Price | Title Company |
|---|---|---|---|
| Gibson Roger | $171,500 | None Available | |
| Tomlinson John A | $119,150 | Lakeside Title & Escrow | |
| Hud | $95,000 | None Available | |
| Anderson Glen E | $134,000 | Homestead Title Agency Ltd | |
| Maple Street Homes Llc | $74,366 | -- |
Source: Public Records
Mortgage History
| Date | Status | Borrower | Loan Amount |
|---|---|---|---|
| Previous Owner | Tomlinson John A | $95,320 | |
| Previous Owner | Anderson Glen E | $132,937 |
Source: Public Records
Tax History
| Year | Tax Paid | Tax Assessment Tax Assessment Total Assessment is a certain percentage of the fair market value that is determined by local assessors to be the total taxable value of land and additions on the property. | Land | Improvement |
|---|---|---|---|---|
| 2025 | $3,255 | $72,190 | $21,000 | $51,190 |
| 2024 | $3,255 | $72,190 | $21,000 | $51,190 |
| 2023 | $2,847 | $56,245 | $10,762 | $45,482 |
| 2022 | $2,818 | $56,245 | $10,763 | $45,483 |
| 2021 | $2,754 | $56,245 | $10,763 | $45,483 |
| 2020 | $2,623 | $45,728 | $8,750 | $36,978 |
| 2019 | $2,666 | $45,728 | $8,750 | $36,978 |
| 2018 | $2,615 | $45,728 | $8,750 | $36,978 |
| 2017 | $2,241 | $39,207 | $7,623 | $31,584 |
| 2016 | $2,294 | $39,207 | $7,623 | $31,584 |
| 2015 | $2,290 | $39,207 | $7,623 | $31,584 |
| 2014 | $2,301 | $35,640 | $6,930 | $28,710 |
| 2013 | $2,263 | $45,010 | $8,750 | $36,260 |
Source: Public Records
Map
Nearby Homes
- 6714 Bedington Ln
- 6671 Waverly Park
- 1327 Chelsea Ct
- 7000 Quellin Blvd
- 1497 Wexler Ct
- 1123 Carrington Place
- 1065 Dunstan Ct
- 1491 Wexler Ct
- 2311 Sir Barton Dr
- 1358 Brookchase Cir
- 5976 Outlook Ct
- 480 Charismatic Ct
- 5817 Montrose Ct
- 767 Elm Tree Dr
- 7409 Wildberry Ct
- 723 Grande Oaks Dr
- 0 Zoar Rd Unit 1832052
- 0 Zoar Rd Unit 934288
- 1544 Soaring Way
- 668 Thornton Dr
- 6636 Abingdon Hall
- 6616 Abingdon Hall
- 6592 Abingdon Hall
- 6658 Abingdon Hall
- 6625 Abingdon Hall
- 6584 Abingdon Hall
- 6635 Abingdon Hall
- 6615 Abingdon Hall
- 6647 Abingdon Hall
- 6605 Abingdon Hall
- 6657 Abingdon Hall
- 6593 Abingdon Hall
- 6574 Abingdon Hall
- 1 Mcintire Rd
- 6573 Abingdon Hall
- 6566 Abingdon Hall
- 6628 N Andover Way
- 6638 N Andover Way
- 6618 N Andover Way
- 6646 N Andover Way
Your Personal Tour Guide
Ask me questions while you tour the home.