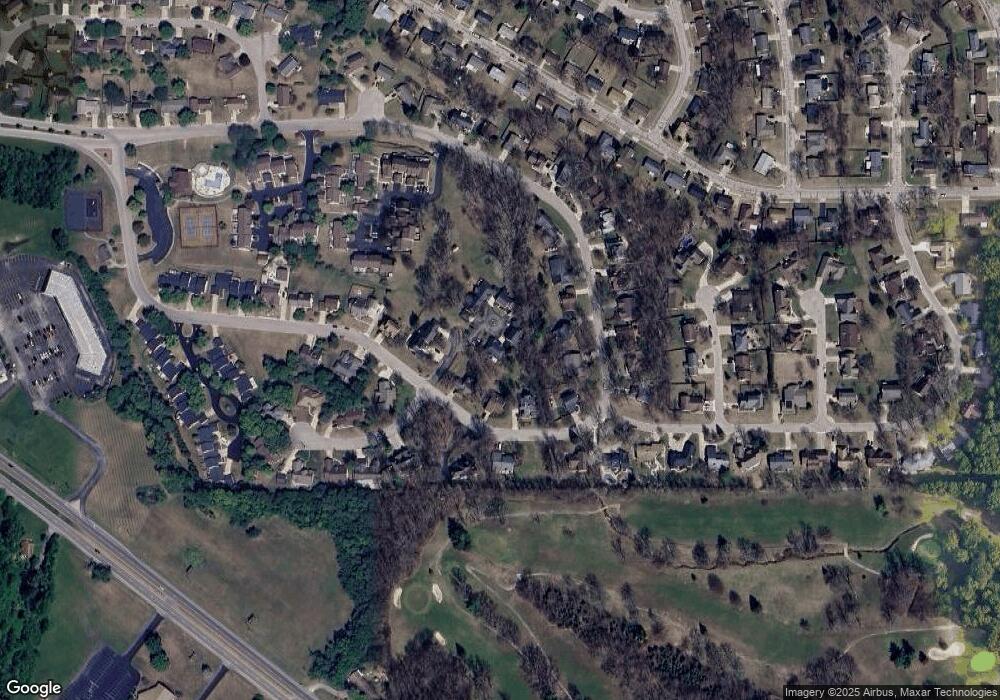
6624 Morry Ct Englewood, OH 45322
Estimated Value: $270,000 - $299,000
3
Beds
3
Baths
2,375
Sq Ft
$121/Sq Ft
Est. Value
About This Home
This home is located at 6624 Morry Ct, Englewood, OH 45322 and is currently estimated at $286,627, approximately $120 per square foot. 6624 Morry Ct is a home located in Montgomery County with nearby schools including Northmoor Elementary School, Northmont High School, and Trotwood Preparatory & Fitness Academy.
Ownership History
Date
Name
Owned For
Owner Type
Purchase Details
Closed on
Feb 26, 2007
Sold by
Zakem Gary M and Estate Of Ann Zakem
Bought by
Hunter Ronald E and Hunter Sharon L
Current Estimated Value
Home Financials for this Owner
Home Financials are based on the most recent Mortgage that was taken out on this home.
Original Mortgage
$136,325
Interest Rate
6.28%
Mortgage Type
Purchase Money Mortgage
Create a Home Valuation Report for This Property
The Home Valuation Report is an in-depth analysis detailing your home's value as well as a comparison with similar homes in the area
Home Values in the Area
Average Home Value in this Area
Purchase History
| Date | Buyer | Sale Price | Title Company |
|---|---|---|---|
| Hunter Ronald E | $143,500 | Midwest Title Company |
Source: Public Records
Mortgage History
| Date | Status | Borrower | Loan Amount |
|---|---|---|---|
| Previous Owner | Hunter Ronald E | $136,325 |
Source: Public Records
Tax History Compared to Growth
Tax History
| Year | Tax Paid | Tax Assessment Tax Assessment Total Assessment is a certain percentage of the fair market value that is determined by local assessors to be the total taxable value of land and additions on the property. | Land | Improvement |
|---|---|---|---|---|
| 2024 | $3,942 | $77,400 | $19,460 | $57,940 |
| 2023 | $3,942 | $77,400 | $19,460 | $57,940 |
| 2022 | $3,542 | $55,690 | $14,000 | $41,690 |
| 2021 | $3,552 | $55,690 | $14,000 | $41,690 |
| 2020 | $3,550 | $55,690 | $14,000 | $41,690 |
| 2019 | $2,905 | $43,310 | $14,000 | $29,310 |
| 2018 | $2,913 | $43,310 | $14,000 | $29,310 |
| 2017 | $2,872 | $43,310 | $14,000 | $29,310 |
| 2016 | $3,480 | $49,740 | $14,000 | $35,740 |
| 2015 | $3,892 | $58,670 | $14,000 | $44,670 |
| 2014 | $3,892 | $58,670 | $14,000 | $44,670 |
| 2012 | -- | $39,200 | $15,750 | $23,450 |
Source: Public Records
Map
Nearby Homes
- 6583 Benjamin Franklin Dr
- 4711 Valley Brook Dr
- 6701 Park Vista Rd
- 4507 Skylark Dr
- 7000 Kinsey Rd
- 6505 Taywood Rd
- 1206 N Union Rd
- 5025 Willow Rd
- 6624 Stranwood Dr
- 6269 Fall Gold Dr
- 5117 Crescent Ridge Dr Unit 115117
- 6497 Burkwood Dr
- 1003 Redwood Rd
- Spruce Plan at Hunters Path
- Walnut Plan at Hunters Path
- Ashton Plan at Hunters Path
- Empress Plan at Hunters Path
- Chestnut Plan at Hunters Path
- Cooper Plan at Hunters Path
- Juniper Plan at Hunters Path
- 6628 Morry Ct
- 6640 Morry Ct Unit 4
- 6644 Morry Ct
- 6636 Morry Ct
- 3909 Valley Brook Dr S
- 4440 Valley Brook Dr
- 3907 Valley Brook Dr S
- 4450 Valley Brook Dr
- 3905 Valley Brook Dr S
- 4430 Valley Brook Dr
- 6601 Morry Ct
- 6605 Morry Ct
- 4460 Valley Brook Dr
- 3903 Valley Brook Dr S
- 3917 Valley Brook Dr S
- 4470 Valley Brook Dr
- 4443 Valley Brook Dr
- 3912 Valley Brook Dr S
- 4433 Valley Brook Dr
- 6142 Persimmon Tree Ct
