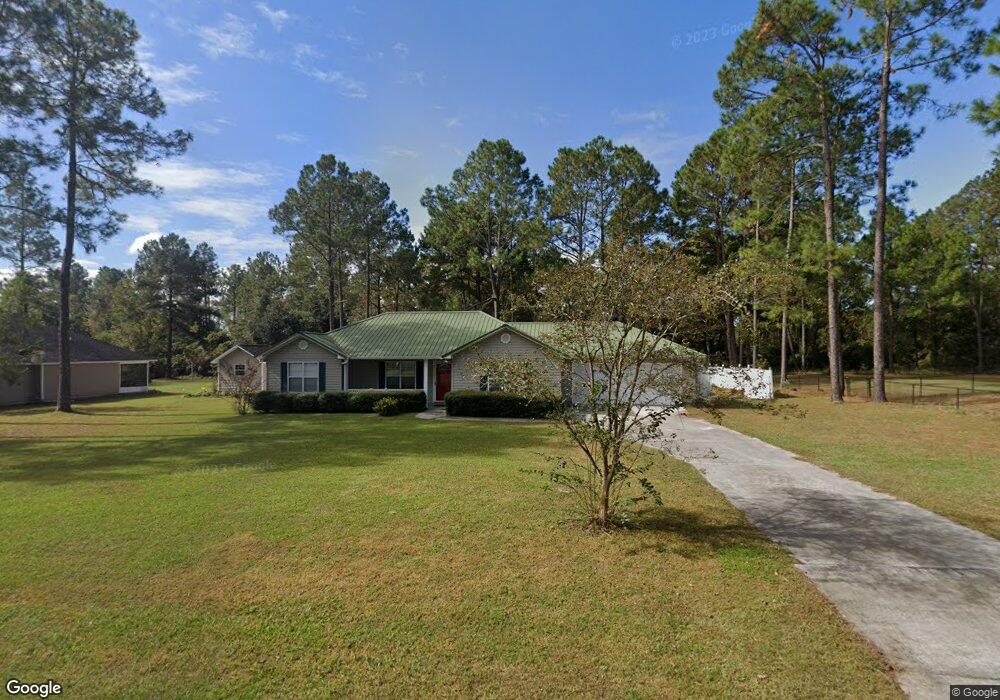
6625 Pine Ridge Cir Blackshear, GA 31516
Estimated Value: $238,000 - $272,000
3
Beds
2
Baths
1,425
Sq Ft
$176/Sq Ft
Est. Value
About This Home
This home is located at 6625 Pine Ridge Cir, Blackshear, GA 31516 and is currently estimated at $250,663, approximately $175 per square foot. 6625 Pine Ridge Cir is a home located in Pierce County with nearby schools including Pierce County High School.
Ownership History
Date
Name
Owned For
Owner Type
Purchase Details
Closed on
Apr 24, 2017
Sold by
Gunter Amy S
Bought by
Lightsey Carroll J
Current Estimated Value
Home Financials for this Owner
Home Financials are based on the most recent Mortgage that was taken out on this home.
Original Mortgage
$128,627
Outstanding Balance
$105,500
Interest Rate
3.87%
Mortgage Type
FHA
Estimated Equity
$145,163
Purchase Details
Closed on
May 12, 2005
Sold by
Mattox Joby
Bought by
Gunter Amy S and Gunter Randall Brian
Home Financials for this Owner
Home Financials are based on the most recent Mortgage that was taken out on this home.
Original Mortgage
$111,647
Interest Rate
5.88%
Mortgage Type
FHA
Purchase Details
Closed on
May 17, 2002
Sold by
Bowen Winston M
Bought by
Mattox Joby and Mattox Tabitha
Purchase Details
Closed on
Oct 9, 1986
Sold by
Bowen W S
Bought by
Bowen Winston M
Create a Home Valuation Report for This Property
The Home Valuation Report is an in-depth analysis detailing your home's value as well as a comparison with similar homes in the area
Home Values in the Area
Average Home Value in this Area
Purchase History
| Date | Buyer | Sale Price | Title Company |
|---|---|---|---|
| Lightsey Carroll J | $131,000 | -- | |
| Gunter Amy S | $113,400 | -- | |
| Mattox Joby | $7,500 | -- | |
| Bowen Winston M | -- | -- |
Source: Public Records
Mortgage History
| Date | Status | Borrower | Loan Amount |
|---|---|---|---|
| Open | Lightsey Carroll J | $128,627 | |
| Previous Owner | Gunter Amy S | $111,647 |
Source: Public Records
Tax History
| Year | Tax Paid | Tax Assessment Tax Assessment Total Assessment is a certain percentage of the fair market value that is determined by local assessors to be the total taxable value of land and additions on the property. | Land | Improvement |
|---|---|---|---|---|
| 2025 | $1,028 | $77,932 | $14,300 | $63,632 |
| 2024 | $986 | $74,992 | $14,300 | $60,692 |
| 2023 | $986 | $73,767 | $14,300 | $59,467 |
| 2022 | $1,108 | $55,721 | $7,020 | $48,701 |
| 2021 | $1,084 | $53,725 | $7,020 | $46,705 |
| 2020 | $1,101 | $51,729 | $7,020 | $44,709 |
| 2019 | $1,110 | $51,729 | $7,020 | $44,709 |
| 2018 | $1,104 | $49,733 | $7,020 | $42,713 |
| 2017 | $1,327 | $48,302 | $7,020 | $41,282 |
| 2016 | $1,262 | $48,302 | $7,020 | $41,282 |
| 2015 | $1,206 | $48,302 | $7,020 | $41,282 |
| 2014 | $1,206 | $48,302 | $7,020 | $41,282 |
| 2013 | $1,206 | $48,302 | $7,020 | $41,282 |
Source: Public Records
Map
Nearby Homes
- 6651 Southside Dr
- 0 Southside Dr
- 6731 Youmans Chapel Rd
- 35 Acres + - Willie Bowen Rd
- 3191 Midway Church Rd
- 3159 Midway Church Rd
- 6929 Greenfield Rd
- 6927 Greenfield Rd
- 6930 Greenfield Rd
- 6923 Greenfield Rd
- 6934 Greenfield Rd
- 6935 Greenfield Rd
- 3602 Meadow Ln
- 4003 Oxford Ln
- 3007 Sun Creek Ln
- 3547 Chapel Ln
- 6917 Sweetwater Cir
- 4160 Deerwood Ln
- 3411 Floyd Dr
- 3889 Jacobs Dr
- 6623 Pine Ridge Cir
- 6627 Pine Ridge Cir
- 6621 Pine Ridge Cir
- 6626 Pine Ridge Cir
- 6629 Pine Ridge Cir
- 6630 Pine Ridge Cir
- 6622 Pine Ridge Cir
- 7048 Willie Bowen Rd
- 6631 Pine Ridge Cir
- 6632 Pine Ridge Cir
- 6620 Pine Ridge Cir
- 6650 Pine Ridge Cir
- 6652 Pine Ridge Cir
- 6617 Pine Ridge Cir
- 6654 Pine Ridge Cir
- 6633 Pine Ridge Cir
- 6618 Pine Ridge Cir
- 6635 Pine Ridge Cir
- 6644 Pine Ridge Cir
- 6656 Pine Ridge Cir
Your Personal Tour Guide
Ask me questions while you tour the home.