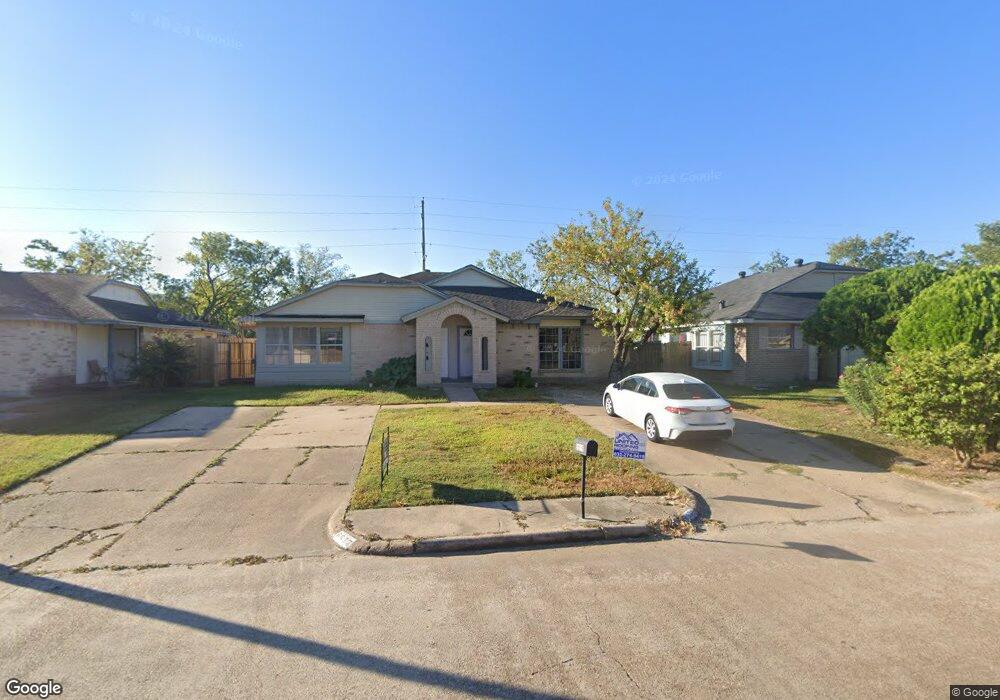
6629 Greenyard Dr Houston, TX 77086
North Houston NeighborhoodEstimated Value: $135,000 - $151,000
2
Beds
1
Bath
957
Sq Ft
$148/Sq Ft
Est. Value
About This Home
This home is located at 6629 Greenyard Dr, Houston, TX 77086 and is currently estimated at $141,798, approximately $148 per square foot. 6629 Greenyard Dr is a home located in Harris County with nearby schools including Kujawa EC/Pre-K/K School, Carmichael Elementary School, and Shotwell Middle School.
Ownership History
Date
Name
Owned For
Owner Type
Purchase Details
Closed on
Jan 24, 2025
Sold by
Webber Mike
Bought by
Sanchez Daniel
Current Estimated Value
Home Financials for this Owner
Home Financials are based on the most recent Mortgage that was taken out on this home.
Original Mortgage
$124,000
Outstanding Balance
$121,963
Interest Rate
6.6%
Mortgage Type
Seller Take Back
Estimated Equity
$19,836
Purchase Details
Closed on
Apr 1, 2022
Sold by
Vicknair Ron
Bought by
Nelria Properties Llc
Purchase Details
Closed on
Mar 1, 2007
Sold by
Roeder Wayne H and Roeder Connie H
Bought by
Vicknair Ron
Home Financials for this Owner
Home Financials are based on the most recent Mortgage that was taken out on this home.
Original Mortgage
$15,678
Interest Rate
6.32%
Mortgage Type
Stand Alone Second
Create a Home Valuation Report for This Property
The Home Valuation Report is an in-depth analysis detailing your home's value as well as a comparison with similar homes in the area
Home Values in the Area
Average Home Value in this Area
Purchase History
| Date | Buyer | Sale Price | Title Company |
|---|---|---|---|
| Sanchez Daniel | -- | None Listed On Document | |
| Nelria Properties Llc | -- | None Listed On Document | |
| Vicknair Ron | -- | American Title Co |
Source: Public Records
Mortgage History
| Date | Status | Borrower | Loan Amount |
|---|---|---|---|
| Open | Sanchez Daniel | $124,000 | |
| Previous Owner | Vicknair Ron | $15,678 | |
| Previous Owner | Vicknair Ron | $47,036 |
Source: Public Records
Tax History Compared to Growth
Tax History
| Year | Tax Paid | Tax Assessment Tax Assessment Total Assessment is a certain percentage of the fair market value that is determined by local assessors to be the total taxable value of land and additions on the property. | Land | Improvement |
|---|---|---|---|---|
| 2025 | $2,424 | $114,369 | $29,249 | $85,120 |
| 2024 | $2,424 | $119,965 | $24,487 | $95,478 |
| 2023 | $2,424 | $119,965 | $24,487 | $95,478 |
| 2022 | $1,975 | $91,171 | $15,305 | $75,866 |
| 2021 | $1,957 | $86,000 | $15,305 | $70,695 |
| 2020 | $1,695 | $70,000 | $15,305 | $54,695 |
| 2019 | $1,857 | $72,000 | $15,305 | $56,695 |
| 2018 | $804 | $56,000 | $15,305 | $40,695 |
| 2017 | $1,395 | $50,982 | $10,203 | $40,779 |
| 2016 | $1,395 | $50,982 | $10,203 | $40,779 |
| 2015 | $1,032 | $39,000 | $10,203 | $28,797 |
| 2014 | $1,032 | $35,206 | $10,203 | $25,003 |
Source: Public Records
Map
Nearby Homes
- 11006 Crinkleawn Dr
- 11009 Panicum Ct
- 11021 Crenchrus Ct
- 6610 Northleaf Dr
- 6654 Brownie Campbell Rd
- 6630 Brownie Campbell Rd
- 11007 Tobasa Ct
- 6722 Winding Trace Dr
- 6615 Winding Trace Dr
- 10522 Northview Dr
- 7002 Sandswept Ln
- 7218 Winding Trace Dr
- 7023 Sandswept Ln
- 6502 Trail Valley Way
- 7222 Northleaf Dr
- 7227 Greenyard Dr
- 6911 Silver Star Dr
- 13610 Kaltenbrun Rd
- 5010 Kale Ct
- 10306 Jillana Kaye Dr
- 6631 Greenyard Dr
- 6633 Greenyard Dr
- 6625 Greenyard Dr
- 6703 Greenyard Dr
- 6623 Greenyard Dr
- 6705 Greenyard Dr
- 6621 Greenyard Dr
- 11002 Crenchrus Ct
- 6707 Greenyard Dr
- 6619 Greenyard Dr
- 11004 Crenchrus Ct
- 11003 Panicum Ct
- 6709 Greenyard Dr
- 6617 Greenyard Dr
- 11003 Crenchrus Ct
- 11005 Panicum Ct
- 6711 Greenyard Dr
- 11005 Crenchrus Ct
- 11007 Panicum Ct
- 6615 Greenyard Dr