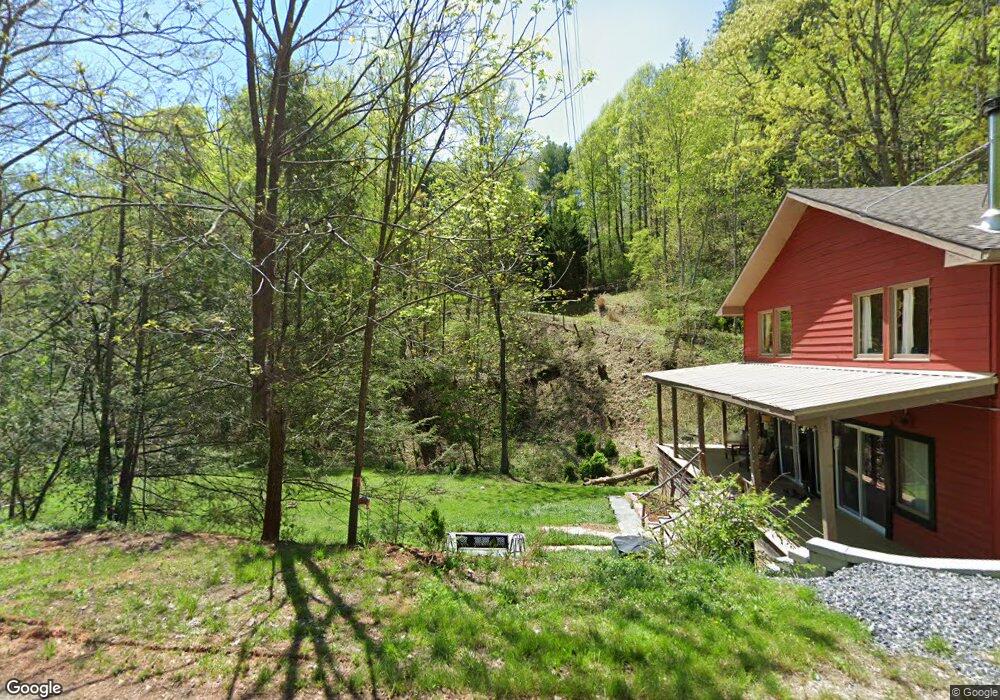
663 Buckner Branch Rd Mars Hill, NC 28754
Estimated Value: $577,000 - $668,000
Studio
--
Bath
2,682
Sq Ft
$227/Sq Ft
Est. Value
About This Home
This home is located at 663 Buckner Branch Rd, Mars Hill, NC 28754 and is currently estimated at $607,588, approximately $226 per square foot. 663 Buckner Branch Rd is a home located in Madison County with nearby schools including Madison Middle School.
Ownership History
Date
Name
Owned For
Owner Type
Purchase Details
Closed on
Nov 20, 2019
Sold by
Lewis Lisa and Eisiminger Shane
Bought by
Deleon Tanya and Deleon Abraham D
Current Estimated Value
Home Financials for this Owner
Home Financials are based on the most recent Mortgage that was taken out on this home.
Original Mortgage
$282,000
Outstanding Balance
$245,404
Interest Rate
3.5%
Mortgage Type
New Conventional
Estimated Equity
$362,184
Purchase Details
Closed on
Apr 8, 2019
Sold by
Cwabs Inc
Bought by
Lewis Lisa and Eisiminger Shane
Purchase Details
Closed on
Feb 29, 2016
Sold by
Commonwealth Land Title Insurance Compan
Bought by
The Bank Of New York Mellon and The Cwabs Inc
Purchase Details
Closed on
Jul 29, 2014
Sold by
Way David C and Way Shelli J
Bought by
Commonwealth Land Title Insurance Co
Purchase Details
Closed on
Nov 17, 2005
Sold by
Cedergren Eric N and Fish Cedergren Susan
Bought by
Way David C and Way Shelli J
Create a Home Valuation Report for This Property
The Home Valuation Report is an in-depth analysis detailing your home's value as well as a comparison with similar homes in the area
Home Values in the Area
Average Home Value in this Area
Purchase History
| Date | Buyer | Sale Price | Title Company |
|---|---|---|---|
| Deleon Tanya | $300,000 | None Available | |
| Lewis Lisa | $104,000 | Servicelink Llc | |
| The Bank Of New York Mellon | -- | None Available | |
| Commonwealth Land Title Insurance Co | $239,246 | None Available | |
| Way David C | $176,000 | None Available |
Source: Public Records
Mortgage History
| Date | Status | Borrower | Loan Amount |
|---|---|---|---|
| Open | Deleon Tanya | $282,000 |
Source: Public Records
Tax History
| Year | Tax Paid | Tax Assessment Tax Assessment Total Assessment is a certain percentage of the fair market value that is determined by local assessors to be the total taxable value of land and additions on the property. | Land | Improvement |
|---|---|---|---|---|
| 2024 | $2,534 | $523,182 | $29,500 | $493,682 |
| 2023 | $1,939 | $298,152 | $31,500 | $266,652 |
| 2022 | $1,939 | $298,152 | $31,500 | $266,652 |
| 2021 | $1,939 | $298,152 | $31,500 | $266,652 |
| 2020 | $1,939 | $298,152 | $31,500 | $266,652 |
| 2019 | $1,248 | $170,013 | $24,806 | $145,207 |
| 2018 | $1,037 | $0 | $0 | $0 |
| 2017 | $1,037 | $0 | $0 | $0 |
| 2016 | $1,037 | $0 | $0 | $0 |
| 2015 | -- | $0 | $0 | $0 |
| 2014 | -- | $170,014 | $24,806 | $145,208 |
| 2013 | -- | $170,014 | $24,806 | $145,208 |
Source: Public Records
Map
Nearby Homes
- 700 Wooded Mountain Trail
- 1 Pearl Way
- 262 Appalachian Way
- 290 Appalachian Way
- 649 Upper Bailey Branch Rd
- 821 Crooked Creek Rd
- 48 Patriot Place Unit 37
- 271 Amanda Dr Unit 6a
- 784 Fred Holcombe Rd
- 404 Amanda Dr
- 00 Granny Shepherd Rd
- 192 Granny Shepherd Rd
- 348 Chandler Creek Rd
- TBD US 19w Hwy
- 2311 Old Mountain Rd
- 351 Buck Springs Run
- 4755 US 23 Hwy
- 00 Windy Gap Rd Unit Tract B
- E- 19 Red Wolf Run None
- 99 Fern Hill Dr
- 661 Buckner Branch Rd
- 656 Buckner Branch Rd
- 562 Buckner Branch Rd
- 564 Buckner Branch Rd
- 685 Buckner Branch Rd
- 560 Buckner Branch Rd
- 482 Buckner Branch Rd
- 690 Buckner Branch Rd
- 436 Buckner Branch Rd
- 370 Buckner Branch Rd
- 788 Shake Rag Rd
- 161 Windy Ridge Rd
- 356 Buckner Branch Rd
- 179 Windy Ridge Rd
- 712 Shake Rag Rd
- 130 Miller Ln
- 224 Buckner Branch Rd
- 201 Miller Ln
- 9999 Jordan Branch Rd
- 508 Shake Rag Rd
Your Personal Tour Guide
Ask me questions while you tour the home.