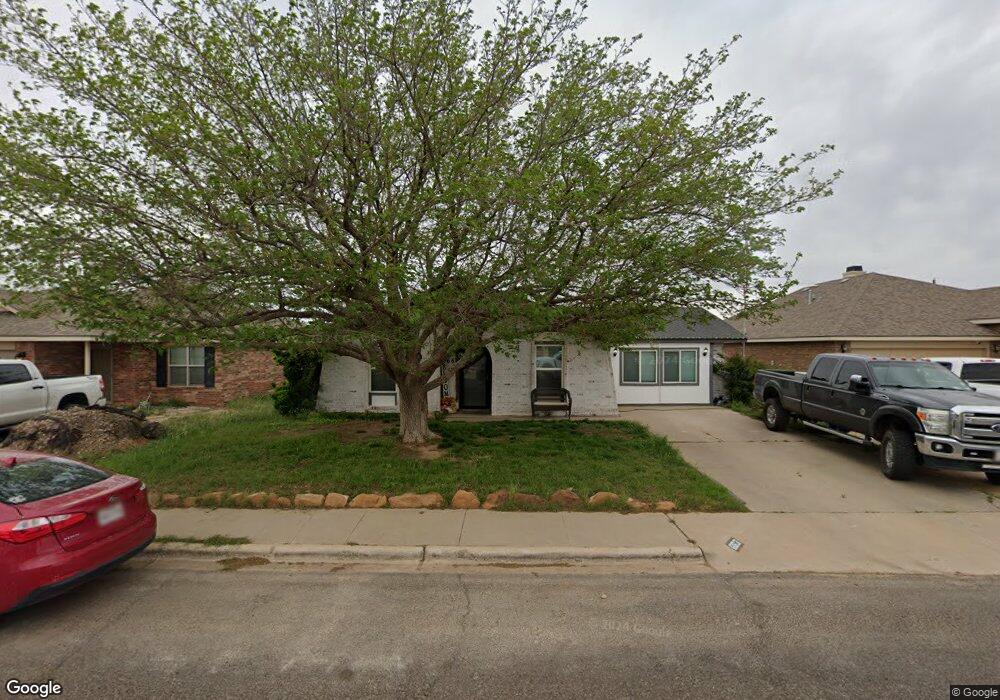
663 Duke Ave Odessa, TX 79765
East Park NeighborhoodEstimated Value: $197,000 - $251,000
3
Beds
2
Baths
1,173
Sq Ft
$186/Sq Ft
Est. Value
About This Home
This home is located at 663 Duke Ave, Odessa, TX 79765 and is currently estimated at $218,142, approximately $185 per square foot. 663 Duke Ave is a home located in Ector County with nearby schools including Lee Buice Elementary School, Wilson & Young Medal of Honor Middle School, and Permian High School.
Ownership History
Date
Name
Owned For
Owner Type
Purchase Details
Closed on
Apr 29, 2010
Sold by
Hurley Brandy Gomez and Hurley Daniel
Bought by
Hurley Brandy Gomez and Hurley Daniel
Current Estimated Value
Home Financials for this Owner
Home Financials are based on the most recent Mortgage that was taken out on this home.
Original Mortgage
$101,546
Outstanding Balance
$68,362
Interest Rate
5.14%
Mortgage Type
FHA
Estimated Equity
$149,780
Purchase Details
Closed on
Apr 18, 2008
Sold by
Rey Billy Joe and Rey Samantha
Bought by
Gomez Brandy
Home Financials for this Owner
Home Financials are based on the most recent Mortgage that was taken out on this home.
Original Mortgage
$100,046
Interest Rate
6%
Mortgage Type
Purchase Money Mortgage
Create a Home Valuation Report for This Property
The Home Valuation Report is an in-depth analysis detailing your home's value as well as a comparison with similar homes in the area
Home Values in the Area
Average Home Value in this Area
Purchase History
| Date | Buyer | Sale Price | Title Company |
|---|---|---|---|
| Hurley Brandy Gomez | -- | Netco | |
| Gomez Brandy | -- | Basin Abstract & Title |
Source: Public Records
Mortgage History
| Date | Status | Borrower | Loan Amount |
|---|---|---|---|
| Open | Hurley Brandy Gomez | $101,546 | |
| Closed | Gomez Brandy | $100,046 |
Source: Public Records
Tax History Compared to Growth
Tax History
| Year | Tax Paid | Tax Assessment Tax Assessment Total Assessment is a certain percentage of the fair market value that is determined by local assessors to be the total taxable value of land and additions on the property. | Land | Improvement |
|---|---|---|---|---|
| 2024 | $1,933 | $173,780 | $16,830 | $156,950 |
| 2023 | $1,422 | $143,690 | $16,830 | $126,860 |
| 2022 | $3,462 | $149,844 | $19,206 | $130,638 |
| 2021 | $3,328 | $141,092 | $19,206 | $121,886 |
| 2020 | $3,136 | $135,248 | $12,210 | $123,038 |
| 2019 | $3,244 | $131,731 | $12,210 | $119,521 |
| 2018 | $2,816 | $119,597 | $12,210 | $107,387 |
| 2017 | $2,749 | $120,698 | $12,210 | $108,488 |
| 2016 | $2,680 | $120,698 | $12,210 | $108,488 |
| 2015 | $1,702 | $120,698 | $12,210 | $108,488 |
| 2014 | $1,702 | $115,531 | $12,210 | $103,321 |
Source: Public Records
Map
Nearby Homes