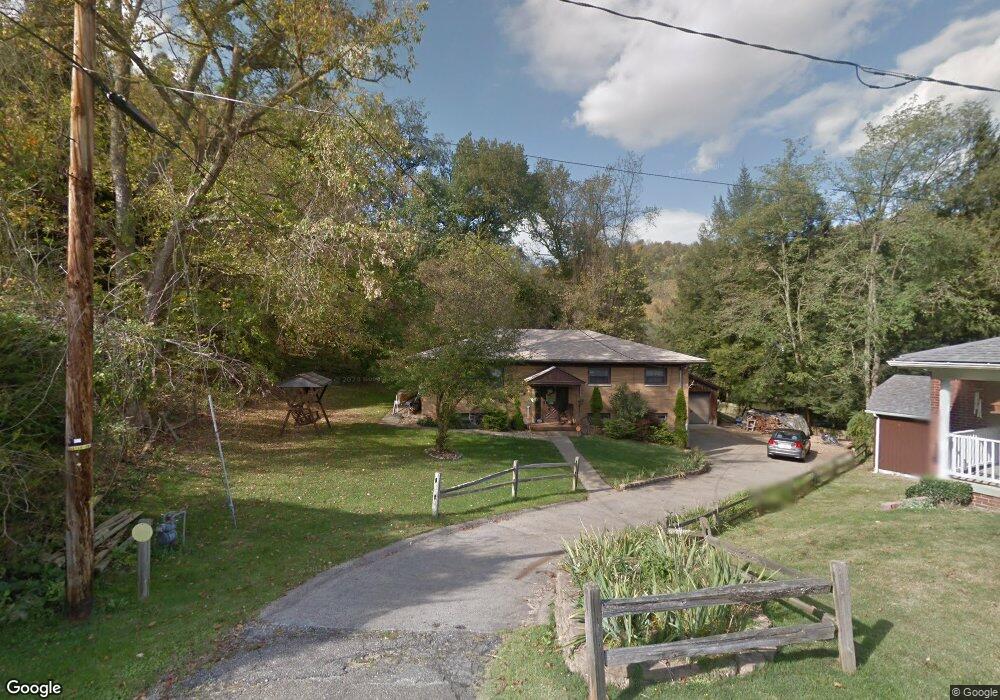
663 Ivy Ln Martins Ferry, OH 43935
Estimated Value: $162,000 - $241,000
3
Beds
1
Bath
1,288
Sq Ft
$152/Sq Ft
Est. Value
About This Home
This home is located at 663 Ivy Ln, Martins Ferry, OH 43935 and is currently estimated at $195,248, approximately $151 per square foot. 663 Ivy Ln is a home located in Belmont County with nearby schools including Anna Marie Ayers Elementary School, Martins Ferry Middle School, and Martins Ferry High School.
Ownership History
Date
Name
Owned For
Owner Type
Purchase Details
Closed on
Sep 13, 2019
Sold by
Weigand Susanne K
Bought by
Weigand Ian
Current Estimated Value
Purchase Details
Closed on
Jul 12, 2019
Sold by
Estate Of John A Weigand
Bought by
Weigand Susanne K
Purchase Details
Closed on
Apr 12, 2019
Sold by
Weigand Susanne K
Bought by
Weigand Ian E
Purchase Details
Closed on
Aug 22, 2018
Sold by
Sall Robert and Sall Palmina Jane
Bought by
Weigand Susanne K
Purchase Details
Closed on
Jul 9, 2018
Sold by
Sall Robert L and Weigand Suzanne K
Bought by
Sall Robert and Sall Palmina Jane
Purchase Details
Closed on
Mar 31, 2011
Sold by
Sall Robert and Sall Palmina Jane
Bought by
Sall Robert L and Sall Palmina Jane
Purchase Details
Closed on
Jan 1, 1987
Sold by
Sall Robert and Palmina Jan
Bought by
Sall Robert and Palmina Jan
Create a Home Valuation Report for This Property
The Home Valuation Report is an in-depth analysis detailing your home's value as well as a comparison with similar homes in the area
Home Values in the Area
Average Home Value in this Area
Purchase History
| Date | Buyer | Sale Price | Title Company |
|---|---|---|---|
| Weigand Ian | -- | None Available | |
| Weigand Susanne K | -- | None Available | |
| Weigand Ian E | -- | None Available | |
| Weigand Susanne K | -- | None Available | |
| Sall Robert | -- | None Available | |
| Sall Robert L | -- | Attorney | |
| Sall Robert | -- | -- |
Source: Public Records
Tax History Compared to Growth
Tax History
| Year | Tax Paid | Tax Assessment Tax Assessment Total Assessment is a certain percentage of the fair market value that is determined by local assessors to be the total taxable value of land and additions on the property. | Land | Improvement |
|---|---|---|---|---|
| 2024 | $2,873 | $60,320 | $5,450 | $54,870 |
| 2023 | $3,064 | $59,270 | $5,440 | $53,830 |
| 2022 | $2,957 | $59,268 | $5,442 | $53,826 |
| 2021 | $2,815 | $59,272 | $5,442 | $53,830 |
| 2020 | $2,472 | $51,540 | $4,730 | $46,810 |
| 2019 | $2,655 | $51,540 | $4,730 | $46,810 |
| 2018 | $1,955 | $51,540 | $4,730 | $46,810 |
| 2017 | $1,801 | $46,830 | $4,760 | $42,070 |
| 2016 | $1,806 | $46,830 | $4,760 | $42,070 |
| 2015 | $1,627 | $46,830 | $4,760 | $42,070 |
| 2014 | $1,518 | $44,020 | $4,330 | $39,690 |
| 2013 | $1,449 | $44,020 | $4,330 | $39,690 |
Source: Public Records
Map
Nearby Homes
- 629 Tulip Ln
- 58841 Glenns Run Rd
- 1408 N 9th St
- 1209 N 8th St
- 2841 Viola Rd
- 136 N 17th St
- 132 N 21st St
- 1105 N 6th St
- 0 Hess Ave
- 101 N 8th St
- 101 N 7th St
- 2300 Warwood Ave
- 50 Warwood Terrace
- 800 Warwood Ave
- 437 Richland Ave
- 111 Warwood Terrace
- 415 Richland Ave
- 600 N Zane Hwy
- 57869 Main St
- 433 N Zane Hwy