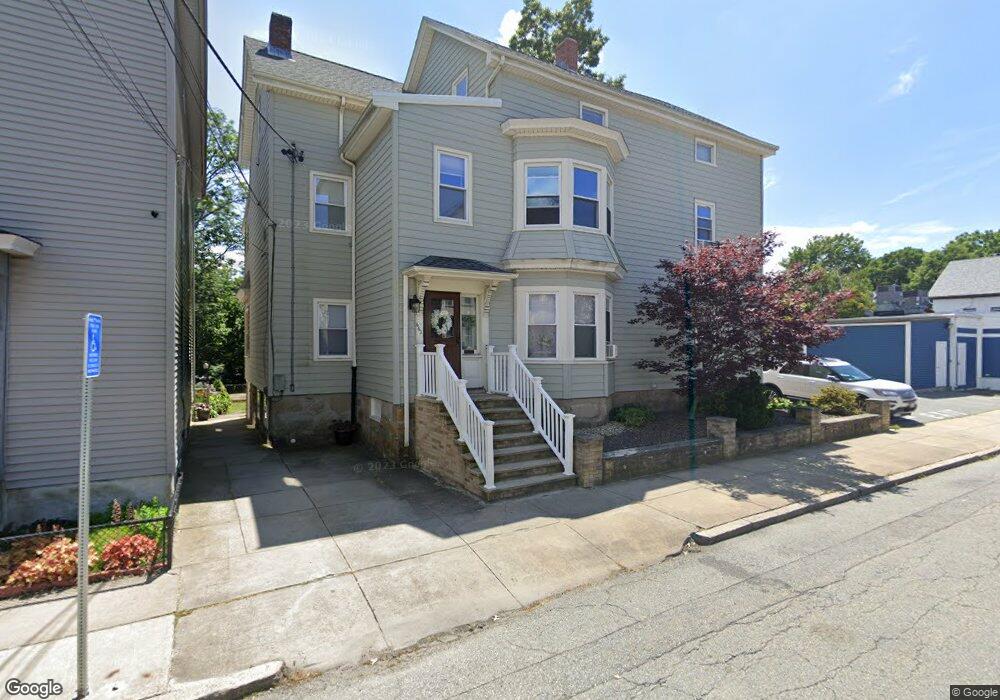
663 Locust St Fall River, MA 02720
Bank Street NeighborhoodEstimated Value: $556,401 - $634,000
6
Beds
3
Baths
3,234
Sq Ft
$182/Sq Ft
Est. Value
About This Home
This home is located at 663 Locust St, Fall River, MA 02720 and is currently estimated at $590,100, approximately $182 per square foot. 663 Locust St is a home located in Bristol County with nearby schools including Mary Fonseca Elementary School, Morton Middle School, and B M C Durfee High School.
Ownership History
Date
Name
Owned For
Owner Type
Purchase Details
Closed on
Jul 3, 2008
Sold by
Soaares Anthony J and Sullivan Claire M
Bought by
Normandin Denise
Current Estimated Value
Home Financials for this Owner
Home Financials are based on the most recent Mortgage that was taken out on this home.
Original Mortgage
$196,000
Outstanding Balance
$126,060
Interest Rate
6.01%
Mortgage Type
Purchase Money Mortgage
Estimated Equity
$464,040
Create a Home Valuation Report for This Property
The Home Valuation Report is an in-depth analysis detailing your home's value as well as a comparison with similar homes in the area
Home Values in the Area
Average Home Value in this Area
Purchase History
| Date | Buyer | Sale Price | Title Company |
|---|---|---|---|
| Normandin Denise | $245,000 | -- |
Source: Public Records
Mortgage History
| Date | Status | Borrower | Loan Amount |
|---|---|---|---|
| Open | Normandin Denise | $196,000 |
Source: Public Records
Tax History
| Year | Tax Paid | Tax Assessment Tax Assessment Total Assessment is a certain percentage of the fair market value that is determined by local assessors to be the total taxable value of land and additions on the property. | Land | Improvement |
|---|---|---|---|---|
| 2025 | $5,908 | $516,000 | $116,800 | $399,200 |
| 2024 | $5,416 | $471,400 | $114,500 | $356,900 |
| 2023 | $5,064 | $412,700 | $103,100 | $309,600 |
| 2022 | $4,679 | $370,800 | $97,300 | $273,500 |
| 2021 | $4,181 | $302,300 | $92,900 | $209,400 |
| 2020 | $3,719 | $257,400 | $88,700 | $168,700 |
| 2019 | $3,636 | $249,400 | $92,700 | $156,700 |
| 2018 | $3,563 | $243,700 | $93,400 | $150,300 |
| 2017 | $3,300 | $235,700 | $93,400 | $142,300 |
| 2016 | $3,206 | $235,200 | $96,300 | $138,900 |
| 2015 | $3,076 | $235,200 | $96,300 | $138,900 |
| 2014 | $3,109 | $247,100 | $96,300 | $150,800 |
Source: Public Records
Map
Nearby Homes
- 669 Locust St
- 249 Linden St
- 237 Linden St
- 229 Linden St
- 677 Locust St
- 308 Seabury St
- 292 Seabury St
- 650 Locust St
- 221 Linden St
- 650 Cherry St
- 650 Cherry St Unit 2
- 638 Locust St Unit 1
- 638 Locust St
- 638 Locust St Unit 2
- 668 Locust St
- 654 Locust St
- 660 Cherry St
- 277 Linden St
- 644 Cherry St
- 236 Linden St
Your Personal Tour Guide
Ask me questions while you tour the home.