Estimated Value: $776,000
4
Beds
4
Baths
3,842
Sq Ft
$202/Sq Ft
Est. Value
About This Home
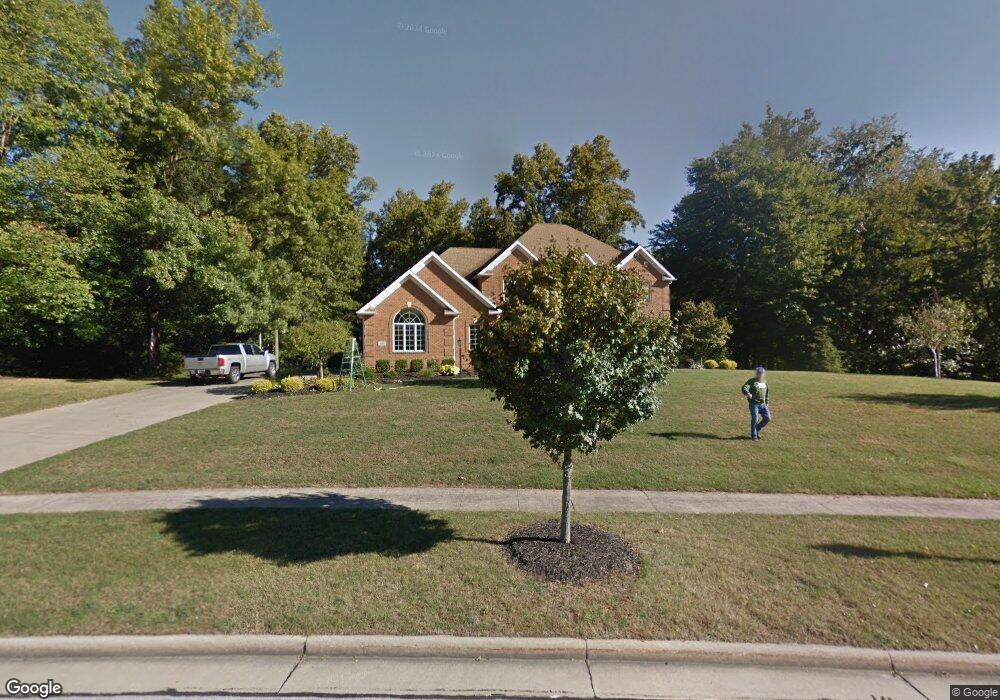
This home is located at 663 Rustic Knoll Dr, Kent, OH 44240 and is currently priced at $776,000, approximately $201 per square foot. 663 Rustic Knoll Dr is a home located in Portage County with nearby schools including Walls Elementary School, Stanton Middle School, and Theodore Roosevelt High School.
Ownership History
Date
Name
Owned For
Owner Type
Purchase Details
Closed on
Apr 21, 2022
Sold by
Crooked River Land Company Ltd
Bought by
Jefferis Eric S and Zullo Melissa D
Current Estimated Value
Purchase Details
Closed on
Aug 10, 2021
Sold by
Garcia Cynthia L and Dickerson Family Trust
Bought by
Jefferis Eric S and Zullo Melissa D
Home Financials for this Owner
Home Financials are based on the most recent Mortgage that was taken out on this home.
Original Mortgage
$520,000
Interest Rate
2.9%
Mortgage Type
New Conventional
Purchase Details
Closed on
Sep 16, 2020
Sold by
Mileski Susan (Trustee) (Rlu-Jo Ann Dickerson)
Bought by
Garcia Cynthia L (Trustee) (Rlu-Jo
Purchase Details
Closed on
Dec 18, 2015
Sold by
Dickerson Jo Ann
Bought by
Mileski Susan
Purchase Details
Closed on
Oct 10, 2013
Sold by
Dickerson Jo Ann
Bought by
Dickerson Jo Ann
Create a Home Valuation Report for This Property
The Home Valuation Report is an in-depth analysis detailing your home's value as well as a comparison with similar homes in the area
Home Values in the Area
Average Home Value in this Area
Purchase History
| Date | Buyer | Sale Price | Title Company |
|---|---|---|---|
| Jefferis Eric S | -- | None Listed On Document | |
| Jefferis Eric S | $650,000 | None Available | |
| Garcia Cynthia L (Trustee) (Rlu-Jo | -- | -- | |
| Mileski Susan | -- | None Available | |
| Dickerson Jo Ann | -- | None Available |
Source: Public Records
Mortgage History
| Date | Status | Borrower | Loan Amount |
|---|---|---|---|
| Previous Owner | Jefferis Eric S | $520,000 |
Source: Public Records
Tax History
| Year | Tax Paid | Tax Assessment Tax Assessment Total Assessment is a certain percentage of the fair market value that is determined by local assessors to be the total taxable value of land and additions on the property. | Land | Improvement |
|---|---|---|---|---|
| 2021 | $9,022 | $170,910 | $38,680 | $132,230 |
| 2020 | $9,101 | $155,690 | $38,680 | $117,010 |
| 2019 | $9,100 | $155,690 | $38,680 | $117,010 |
| 2018 | $9,009 | $143,330 | $38,680 | $104,650 |
| 2017 | $9,009 | $143,330 | $38,680 | $104,650 |
| 2016 | $8,987 | $143,330 | $38,680 | $104,650 |
| 2015 | $8,989 | $143,330 | $38,680 | $104,650 |
| 2014 | $9,140 | $143,330 | $38,680 | $104,650 |
| 2013 | $9,074 | $143,330 | $38,680 | $104,650 |
Source: Public Records
Map
Nearby Homes
- 6318 1st Ave
- 6235 1st Ave
- 1585 Kent St
- 131 Wanda Ct
- 832 Harold St
- 2070 Cypress Ave
- 1067 Erin Dr
- 994 Erin Dr
- 2135 Rankin Dr
- 614 Pioneer St
- 2262 Leonard St
- 490 Johnson Rd
- 957 Edgewater Cir Unit 20
- 6181 Washington St
- 835 Mae St
- 1005 Vine St
- 4363 Ohio 43
- 7578 Heather Cir Unit 3
- 895 Highridge Ln
- 0 Brady Lake Rd Unit 5043902
- SL #45 Rustic Knoll Dr
- 647 Rustic Knoll Dr
- 1596 Elizabeth Ct
- 681 Rustic Knoll Dr
- 631 Rustic Knoll Dr
- 1584 Elizabeth Ct
- 630 Rustic Knoll Dr
- 670 Rustic Knoll Dr
- Lot 63 Dominion
- 1583 Elizabeth Ct
- 621 Rustic Knoll Dr
- 661 Beechmont Place Dr
- 711 Dominion Dr
- 1572 Elizabeth Ct
- Lot 70 Dominion
- 671 Beechmont Place Dr
- 719 Dominion Dr
- 611 Rustic Knoll Dr
- 702 Dominion Dr
- 1558 Elizabeth Ct
Your Personal Tour Guide
Ask me questions while you tour the home.