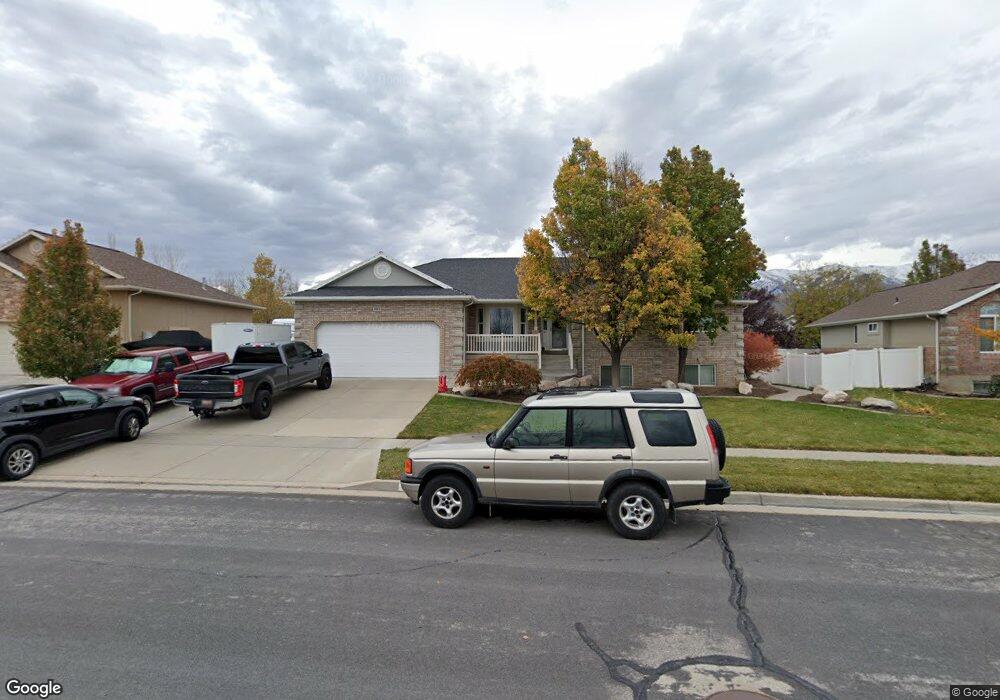
663 S 175 W Layton, UT 84041
Estimated Value: $563,000 - $740,000
6
Beds
4
Baths
3,597
Sq Ft
$186/Sq Ft
Est. Value
About This Home
This home is located at 663 S 175 W, Layton, UT 84041 and is currently estimated at $670,521, approximately $186 per square foot. 663 S 175 W is a home located in Davis County with nearby schools including Layton Elementary School, Fairfield Junior High School, and Davis High School.
Ownership History
Date
Name
Owned For
Owner Type
Purchase Details
Closed on
Mar 30, 2017
Sold by
Bennett Steven R
Bought by
Bennett Steven R and Bennett Stacy A
Current Estimated Value
Home Financials for this Owner
Home Financials are based on the most recent Mortgage that was taken out on this home.
Original Mortgage
$365,262
Outstanding Balance
$300,336
Interest Rate
3.87%
Mortgage Type
FHA
Estimated Equity
$370,185
Purchase Details
Closed on
Sep 17, 2003
Sold by
Barry Ester
Bought by
Barry Ester and Ester Barry Trust
Home Financials for this Owner
Home Financials are based on the most recent Mortgage that was taken out on this home.
Original Mortgage
$130,000
Interest Rate
6.3%
Mortgage Type
Purchase Money Mortgage
Purchase Details
Closed on
Aug 9, 2003
Sold by
Ed Green Construction Inc
Bought by
Barry Ester
Home Financials for this Owner
Home Financials are based on the most recent Mortgage that was taken out on this home.
Original Mortgage
$130,000
Interest Rate
6.3%
Mortgage Type
Purchase Money Mortgage
Create a Home Valuation Report for This Property
The Home Valuation Report is an in-depth analysis detailing your home's value as well as a comparison with similar homes in the area
Home Values in the Area
Average Home Value in this Area
Purchase History
| Date | Buyer | Sale Price | Title Company |
|---|---|---|---|
| Bennett Steven R | -- | Backman Title | |
| Bennett Steven R | -- | Backman Title | |
| Barry Ester | -- | Security Title Company | |
| Barry Ester | -- | Security Title Company |
Source: Public Records
Mortgage History
| Date | Status | Borrower | Loan Amount |
|---|---|---|---|
| Open | Bennett Steven R | $365,262 | |
| Previous Owner | Barry Ester | $130,000 |
Source: Public Records
Tax History Compared to Growth
Tax History
| Year | Tax Paid | Tax Assessment Tax Assessment Total Assessment is a certain percentage of the fair market value that is determined by local assessors to be the total taxable value of land and additions on the property. | Land | Improvement |
|---|---|---|---|---|
| 2025 | $3,401 | $356,950 | $126,202 | $230,748 |
| 2024 | $3,079 | $325,600 | $136,260 | $189,340 |
| 2023 | $3,069 | $572,000 | $141,605 | $430,395 |
| 2022 | $3,494 | $353,650 | $83,995 | $269,655 |
| 2021 | $3,041 | $459,000 | $125,987 | $333,013 |
| 2020 | $2,769 | $401,000 | $107,199 | $293,801 |
| 2019 | $2,700 | $383,000 | $107,080 | $275,920 |
| 2018 | $2,493 | $355,000 | $94,237 | $260,763 |
| 2016 | $2,226 | $163,515 | $39,329 | $124,186 |
| 2015 | $2,232 | $155,650 | $39,329 | $116,321 |
| 2014 | $2,493 | $177,720 | $39,329 | $138,391 |
| 2013 | -- | $151,367 | $37,374 | $113,993 |
Source: Public Records
Map
Nearby Homes
- 267 S Melody St
- 774 W Farming Way
- 268 E 900 S
- 562 S 850 W
- 282 E 925 S
- 174 W Dawson St
- 1038 S Old Towne Rd
- 362 S 950 W
- 256 Seemore Dr
- 355 W Gentile St
- 1042 W Shoreline Dr
- 356 W 25 N
- 296 S 950 W
- 473 E Alice Way
- 493 E Alice Way
- 1429 W Lincoln Way
- 485 W 100 N
- 557 S Angel St
- Creighton Farmhouse Plan at Angel Hill
- 593 Kimball Dr