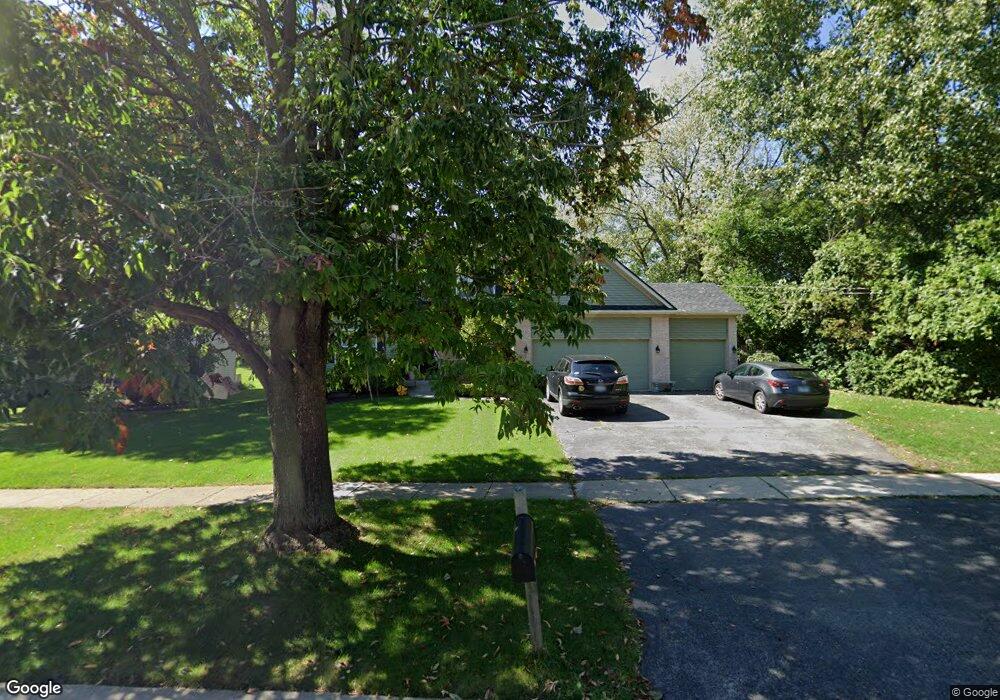
663 S Van Buren St Batavia, IL 60510
Southeast Batavia NeighborhoodEstimated Value: $519,000 - $541,539
4
Beds
--
Bath
2,364
Sq Ft
$224/Sq Ft
Est. Value
About This Home
This home is located at 663 S Van Buren St, Batavia, IL 60510 and is currently estimated at $529,885, approximately $224 per square foot. 663 S Van Buren St is a home located in Kane County with nearby schools including J B Nelson Elementary School, Sam Rotolo Middle School, and Batavia Sr High School.
Ownership History
Date
Name
Owned For
Owner Type
Purchase Details
Closed on
Aug 21, 2000
Sold by
Vandemark J Douglas and Doulas Vandermark J
Bought by
Wecker Paul A and Wecker Jennifer L
Current Estimated Value
Home Financials for this Owner
Home Financials are based on the most recent Mortgage that was taken out on this home.
Original Mortgage
$172,000
Outstanding Balance
$61,925
Interest Rate
8.12%
Estimated Equity
$467,960
Purchase Details
Closed on
May 20, 1999
Sold by
Viereckl Heinrich and Viereckl Elfriede
Bought by
Vandermark Douglas
Purchase Details
Closed on
Oct 1, 1997
Sold by
Carso Robert D and Carso Jennifer L
Bought by
Viereckl Heinrich and Viereckl Elfriede
Purchase Details
Closed on
Mar 22, 1997
Sold by
Viereckl Heinrich and Viereckl Elfriedel
Bought by
Carso Robert E and Carso Jennifer I
Create a Home Valuation Report for This Property
The Home Valuation Report is an in-depth analysis detailing your home's value as well as a comparison with similar homes in the area
Home Values in the Area
Average Home Value in this Area
Purchase History
| Date | Buyer | Sale Price | Title Company |
|---|---|---|---|
| Wecker Paul A | $272,333 | Fox Title Company | |
| Vandermark Douglas | $32,000 | -- | |
| Viereckl Heinrich | -- | -- | |
| Carso Robert E | $40,000 | -- |
Source: Public Records
Mortgage History
| Date | Status | Borrower | Loan Amount |
|---|---|---|---|
| Open | Wecker Paul A | $172,000 |
Source: Public Records
Tax History Compared to Growth
Tax History
| Year | Tax Paid | Tax Assessment Tax Assessment Total Assessment is a certain percentage of the fair market value that is determined by local assessors to be the total taxable value of land and additions on the property. | Land | Improvement |
|---|---|---|---|---|
| 2024 | $11,653 | $155,387 | $27,794 | $127,593 |
| 2023 | $11,415 | $141,030 | $25,226 | $115,804 |
| 2022 | $11,482 | $137,500 | $23,576 | $113,924 |
| 2021 | $11,028 | $130,406 | $22,360 | $108,046 |
| 2020 | $10,758 | $127,899 | $21,930 | $105,969 |
| 2019 | $10,585 | $123,372 | $21,154 | $102,218 |
| 2018 | $10,176 | $118,672 | $20,348 | $98,324 |
| 2017 | $9,923 | $114,759 | $19,677 | $95,082 |
| 2016 | $9,713 | $111,417 | $19,104 | $92,313 |
| 2015 | -- | $108,880 | $18,669 | $90,211 |
| 2014 | -- | $105,452 | $18,081 | $87,371 |
| 2013 | -- | $106,523 | $20,857 | $85,666 |
Source: Public Records
Map
Nearby Homes
- 304 Manchester Ave
- Lot 4 Manchester Ave
- 860 S River St
- 621 Young Ave
- 129 S Prairie St
- 245 Stone Manor Cir
- 404 S Batavia Ave
- 221 Elm St
- 948 Woodland Ave
- 717 S Batavia Ave
- 428 E Wilson St
- 345 Main St
- 473 Bond Dr
- 330 First St
- 1010 S Jefferson St
- 637 E Wilson St
- 514 Main St
- 1676 Carlstedt Dr
- Lot 1 Center St
- 625 S Harrison St
- 701 S Van Buren St
- 649 S Van Buren St
- 711 S Van Buren St
- 664 S Van Buren St
- 639 S Van Buren St
- 721 S Van Buren St
- 710 S Van Buren St Unit 1
- 646 S Van Buren St
- 809 S Van Buren St
- 720 S Van Buren St
- 600 S River St
- 629 S Van Buren St
- 580 S River St
- 819 S Van Buren St
- 625 S Van Buren St
- 808 S Van Buren St
- 402 Kickapoo Ave
- 621 S Van Buren St
- 411 Kickapoo Ave
- 333 Manchester Ave