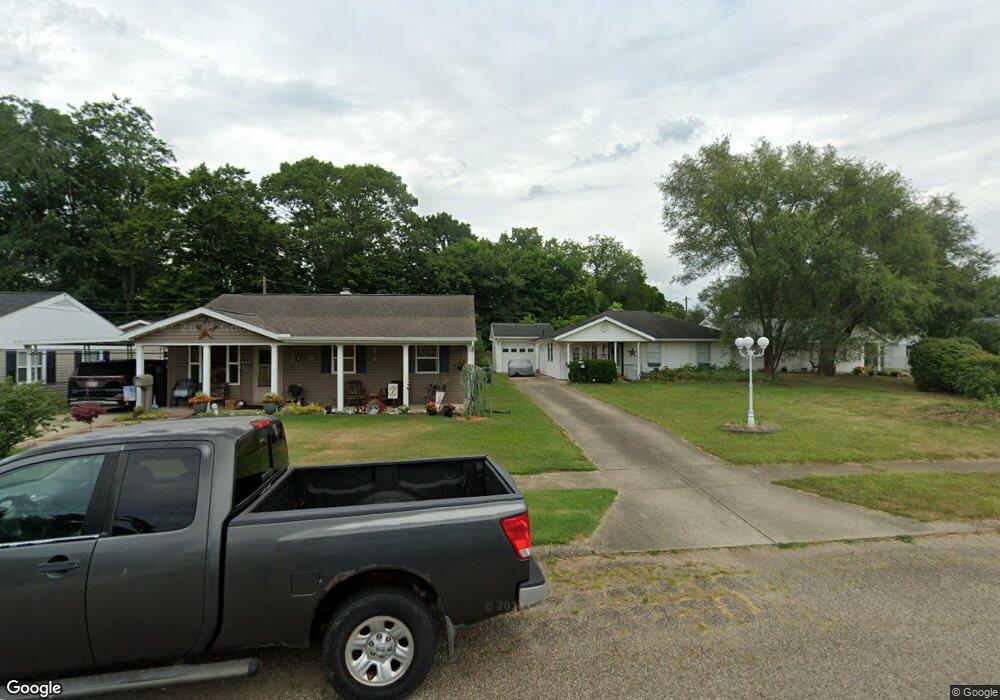
663 Salisbury Rd Waverly, OH 45690
Estimated Value: $154,222 - $183,000
3
Beds
2
Baths
1,405
Sq Ft
$122/Sq Ft
Est. Value
About This Home
This home is located at 663 Salisbury Rd, Waverly, OH 45690 and is currently estimated at $171,806, approximately $122 per square foot. 663 Salisbury Rd is a home located in Pike County with nearby schools including Waverly Primary School, Waverly Intermediate School, and Waverly Junior High School.
Ownership History
Date
Name
Owned For
Owner Type
Purchase Details
Closed on
Jul 20, 2006
Sold by
Cooper Patricia and Cooper Patricia K
Bought by
Collinsworth Jason L
Current Estimated Value
Purchase Details
Closed on
Jun 24, 2005
Sold by
Smith Keith
Bought by
Cooper Patricia
Home Financials for this Owner
Home Financials are based on the most recent Mortgage that was taken out on this home.
Original Mortgage
$20,900
Interest Rate
5.75%
Mortgage Type
Credit Line Revolving
Create a Home Valuation Report for This Property
The Home Valuation Report is an in-depth analysis detailing your home's value as well as a comparison with similar homes in the area
Home Values in the Area
Average Home Value in this Area
Purchase History
| Date | Buyer | Sale Price | Title Company |
|---|---|---|---|
| Collinsworth Jason L | $116,000 | None Available | |
| Cooper Patricia | $104,500 | None Available |
Source: Public Records
Mortgage History
| Date | Status | Borrower | Loan Amount |
|---|---|---|---|
| Previous Owner | Cooper Patricia | $20,900 |
Source: Public Records
Tax History Compared to Growth
Tax History
| Year | Tax Paid | Tax Assessment Tax Assessment Total Assessment is a certain percentage of the fair market value that is determined by local assessors to be the total taxable value of land and additions on the property. | Land | Improvement |
|---|---|---|---|---|
| 2024 | $1,291 | $36,480 | $3,260 | $33,220 |
| 2023 | $1,291 | $36,480 | $3,260 | $33,220 |
| 2022 | $1,201 | $29,440 | $5,260 | $24,180 |
| 2021 | $1,178 | $29,440 | $5,260 | $24,180 |
| 2020 | $1,178 | $29,440 | $5,260 | $24,180 |
| 2019 | $1,008 | $24,950 | $4,460 | $20,490 |
| 2018 | $1,089 | $24,950 | $4,460 | $20,490 |
| 2017 | $1,081 | $24,950 | $4,460 | $20,490 |
| 2016 | $1,171 | $28,380 | $4,390 | $23,990 |
| 2015 | $1,171 | $28,380 | $4,390 | $23,990 |
| 2014 | $1,133 | $28,380 | $4,390 | $23,990 |
| 2013 | $1,148 | $28,380 | $4,390 | $23,990 |
| 2012 | $1,175 | $28,380 | $4,390 | $23,990 |
Source: Public Records
Map
Nearby Homes