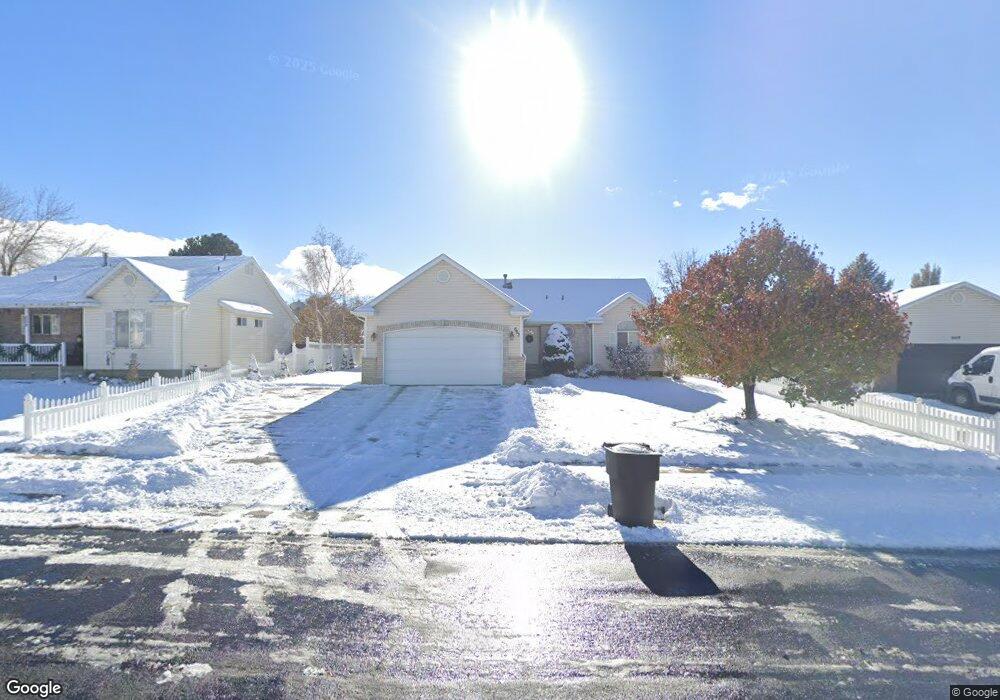
663 W 2050 N Clearfield, UT 84015
Estimated Value: $472,000 - $500,313
5
Beds
3
Baths
2,393
Sq Ft
$206/Sq Ft
Est. Value
About This Home
This home is located at 663 W 2050 N, Clearfield, UT 84015 and is currently estimated at $492,328, approximately $205 per square foot. 663 W 2050 N is a home located in Davis County with nearby schools including Sunset School, Sunset Junior High School, and Northridge High School.
Ownership History
Date
Name
Owned For
Owner Type
Purchase Details
Closed on
Jun 24, 2013
Sold by
Goodwin Bradley D
Bought by
Goodwin Bradley D and Goodwin Ioana
Current Estimated Value
Home Financials for this Owner
Home Financials are based on the most recent Mortgage that was taken out on this home.
Original Mortgage
$191,862
Outstanding Balance
$138,764
Interest Rate
3.87%
Mortgage Type
FHA
Estimated Equity
$353,564
Purchase Details
Closed on
Feb 25, 2009
Sold by
Reynolds William L and Reynolds Jane M
Bought by
Goodwin Bradley D
Home Financials for this Owner
Home Financials are based on the most recent Mortgage that was taken out on this home.
Original Mortgage
$208,587
Interest Rate
4.91%
Mortgage Type
FHA
Purchase Details
Closed on
Apr 22, 1999
Sold by
Rainey Construction Inc
Bought by
Reynolds William L and Reynolds Jane M
Home Financials for this Owner
Home Financials are based on the most recent Mortgage that was taken out on this home.
Original Mortgage
$124,900
Interest Rate
7.1%
Purchase Details
Closed on
Mar 26, 1998
Sold by
Benchmark Real Estate Company
Bought by
Rainey Construction Inc
Create a Home Valuation Report for This Property
The Home Valuation Report is an in-depth analysis detailing your home's value as well as a comparison with similar homes in the area
Home Values in the Area
Average Home Value in this Area
Purchase History
| Date | Buyer | Sale Price | Title Company |
|---|---|---|---|
| Goodwin Bradley D | -- | Backman Title Servic | |
| Goodwin Bradley D | -- | Security Title Of Davis C | |
| Reynolds William L | -- | First American Title Co | |
| Rainey Construction Inc | -- | Bonneville Title Company Inc |
Source: Public Records
Mortgage History
| Date | Status | Borrower | Loan Amount |
|---|---|---|---|
| Open | Goodwin Bradley D | $191,862 | |
| Closed | Goodwin Bradley D | $208,587 | |
| Previous Owner | Reynolds William L | $124,900 |
Source: Public Records
Tax History Compared to Growth
Tax History
| Year | Tax Paid | Tax Assessment Tax Assessment Total Assessment is a certain percentage of the fair market value that is determined by local assessors to be the total taxable value of land and additions on the property. | Land | Improvement |
|---|---|---|---|---|
| 2025 | $2,671 | $256,850 | $85,155 | $171,695 |
| 2024 | $2,572 | $248,600 | $94,124 | $154,476 |
| 2023 | $2,443 | $437,000 | $106,177 | $330,823 |
| 2022 | $2,580 | $255,201 | $66,072 | $189,129 |
| 2021 | $2,289 | $336,000 | $80,820 | $255,180 |
| 2020 | $1,990 | $289,000 | $67,689 | $221,311 |
| 2019 | $1,889 | $268,000 | $80,934 | $187,066 |
| 2018 | $1,793 | $250,000 | $68,602 | $181,398 |
| 2016 | $1,730 | $124,521 | $26,505 | $98,016 |
| 2015 | $1,748 | $119,626 | $26,505 | $93,121 |
| 2014 | $1,603 | $111,462 | $26,505 | $84,957 |
| 2013 | -- | $108,765 | $27,143 | $81,622 |
Source: Public Records
Map
Nearby Homes
- 648 W 2200 N
- 2177 N 450 W
- 1746 N 475 W
- 1721 N 400 W
- 1696 N 475 W
- 2382 N 770 W
- 1874 N 200 W
- 2486 N 690 W
- 1974 N 75 W
- 2085 N Main St Unit 409
- 2085 N Main St Unit 108
- 2085 N Main St Unit 401
- 2085 N Main St Unit 308
- 2085 N Main St Unit 116
- 2085 N Main St Unit 201
- 2085 N Main St Unit 402
- 2085 N Main St Unit 202
- 2085 N Main St Unit 301
- 2085 N Main St Unit 302
- 2085 N Main St Unit 115