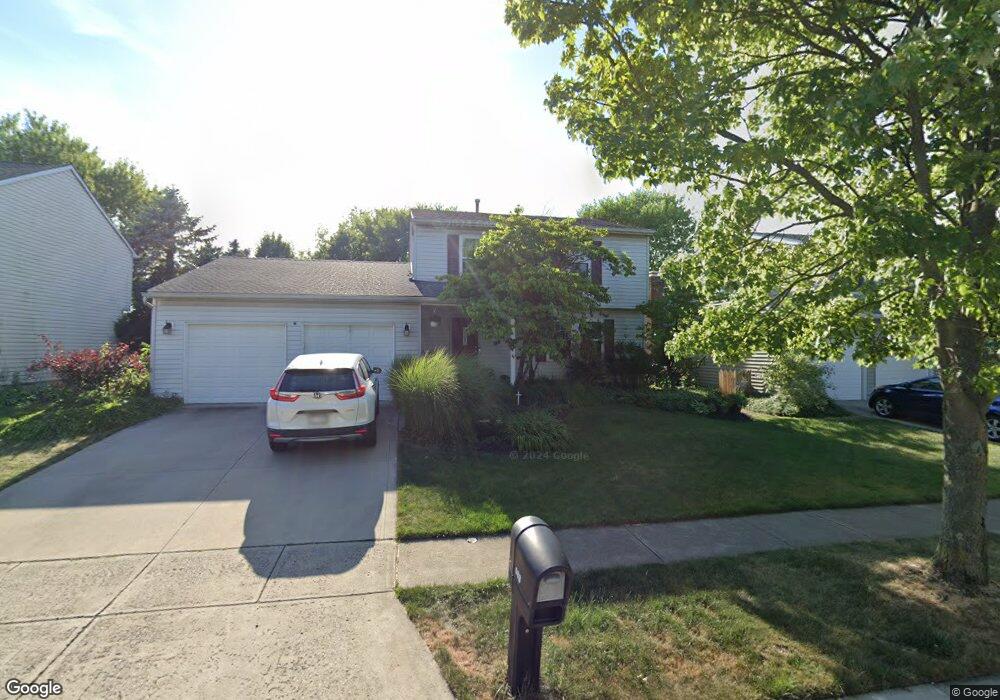
663 Waybaugh Dr Columbus, OH 43230
Woodside Green NeighborhoodEstimated Value: $390,000 - $422,000
3
Beds
3
Baths
1,734
Sq Ft
$231/Sq Ft
Est. Value
About This Home
This home is located at 663 Waybaugh Dr, Columbus, OH 43230 and is currently estimated at $400,351, approximately $230 per square foot. 663 Waybaugh Dr is a home located in Franklin County with nearby schools including Royal Manor Elementary School, Gahanna West Middle School, and Lincoln High School.
Ownership History
Date
Name
Owned For
Owner Type
Purchase Details
Closed on
Sep 20, 1988
Current Estimated Value
Purchase Details
Closed on
Jul 14, 1988
Create a Home Valuation Report for This Property
The Home Valuation Report is an in-depth analysis detailing your home's value as well as a comparison with similar homes in the area
Home Values in the Area
Average Home Value in this Area
Purchase History
We collect this data history from publicly available records. To have your information removed, we recommend requesting removal directly through your county’s website.
| Date | Buyer | Sale Price | Title Company |
|---|---|---|---|
| -- | $94,900 | -- | |
| -- | $17,300 | -- |
Source: Public Records
Tax History
| Year | Tax Paid | Tax Assessment Tax Assessment Total Assessment is a certain percentage of the fair market value that is determined by local assessors to be the total taxable value of land and additions on the property. | Land | Improvement |
|---|---|---|---|---|
| 2025 | $6,782 | $115,120 | $31,500 | $83,620 |
| 2024 | $6,782 | $115,120 | $31,500 | $83,620 |
| 2023 | $6,697 | $115,115 | $31,500 | $83,615 |
| 2022 | $6,032 | $80,780 | $18,900 | $61,880 |
| 2021 | $5,834 | $80,780 | $18,900 | $61,880 |
| 2020 | $5,785 | $80,780 | $18,900 | $61,880 |
| 2019 | $4,846 | $67,520 | $15,750 | $51,770 |
| 2018 | $4,537 | $67,520 | $15,750 | $51,770 |
| 2017 | $4,353 | $67,520 | $15,750 | $51,770 |
| 2016 | $4,259 | $58,880 | $17,120 | $41,760 |
| 2015 | $4,262 | $58,880 | $17,120 | $41,760 |
| 2014 | $4,229 | $58,880 | $17,120 | $41,760 |
| 2013 | $4,200 | $58,870 | $17,115 | $41,755 |
Source: Public Records
Map
Nearby Homes
- 536 Springwood Lake Dr
- 586 Pinegrove Place
- 639 Tall Oaks Dr
- 397 Mccutcheon Rd
- 638 Ridenour Rd
- 668 Founders Ridge Dr
- 585 Tall Oaks Dr
- 351 Morgan Ln
- 825 Lindenhaven Rd
- 256 Carlin Ct W
- 475 Denwood Ct
- 348 Forestwood Dr
- 445 N Stygler Rd
- 440 Deerwood Ave E
- 215 Founders Ct
- 721 Mistletoe St
- 412 Denwood Dr S
- 3877 Hines Rd
- 439 Baywood Place
- 910 Hartney Dr
- 657 Waybaugh Dr
- 651 Waybaugh Dr
- 669 Waybaugh Dr
- 645 Waybaugh Dr
- 415 Woodtree Ct
- 420 Olympia Fields Ct
- 675 Waybaugh Dr
- 409 Woodtree Ct
- 416 Olympia Fields Ct
- 681 Waybaugh Dr
- 410 Woodtree Ct
- 636 Waybaugh Dr
- 403 Woodtree Ct
- 687 Waybaugh Dr
- 412 Olympia Fields Ct
- 404 Woodtree Ct
- 419 Olympia Fields Ct
- 568 Lake Knoll Ct
- 693 Waybaugh Dr
- 415 Olympia Fields Ct
Your Personal Tour Guide
Ask me questions while you tour the home.