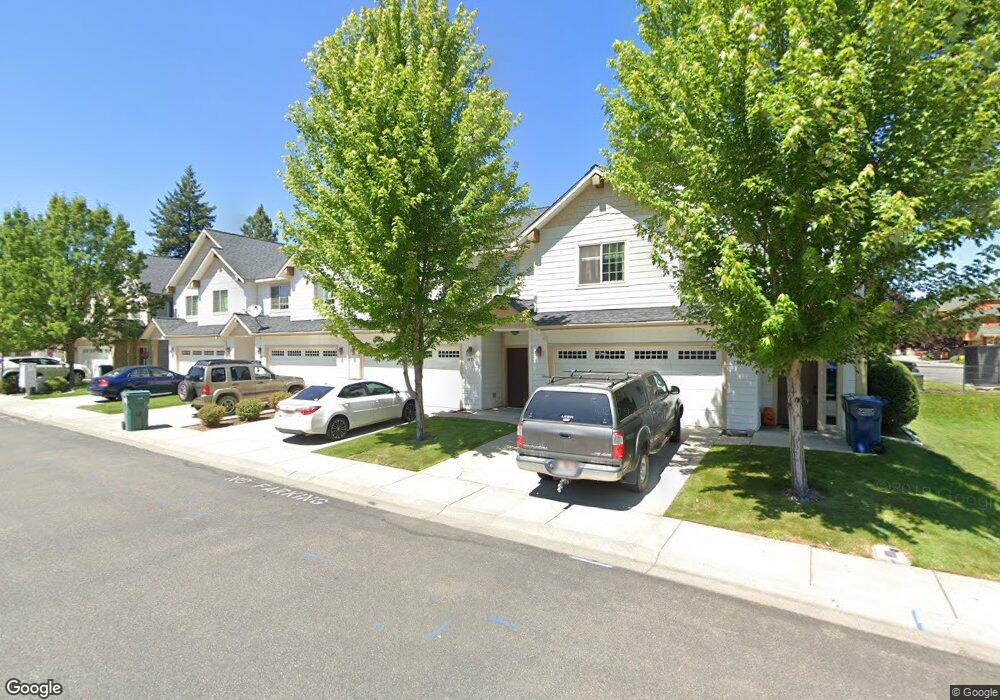
6630 N Spurwing Loop Unit 303 Coeur D'Alene, ID 83815
Ramsey-Woodland NeighborhoodEstimated Value: $343,000 - $358,000
3
Beds
2
Baths
1,208
Sq Ft
$292/Sq Ft
Est. Value
About This Home
This home is located at 6630 N Spurwing Loop Unit 303, Coeur D'Alene, ID 83815 and is currently estimated at $352,198, approximately $291 per square foot. 6630 N Spurwing Loop Unit 303 is a home located in Kootenai County with nearby schools including Winton Elementary School, Woodland Middle School, and Lake City High School.
Ownership History
Date
Name
Owned For
Owner Type
Purchase Details
Closed on
Jun 2, 2016
Sold by
Christensen Danielle M
Bought by
Christensen Danielle M
Current Estimated Value
Purchase Details
Closed on
Nov 12, 2007
Sold by
Callies Tricia A and Callies Randy L
Bought by
Kelly Michael A and Kelly Tracey D
Home Financials for this Owner
Home Financials are based on the most recent Mortgage that was taken out on this home.
Original Mortgage
$43,000
Interest Rate
6.38%
Mortgage Type
New Conventional
Purchase Details
Closed on
Feb 1, 2006
Sold by
Pheasant Run Llc
Bought by
Callies Tricia A and Callies Randal L
Home Financials for this Owner
Home Financials are based on the most recent Mortgage that was taken out on this home.
Original Mortgage
$141,920
Interest Rate
7%
Mortgage Type
Adjustable Rate Mortgage/ARM
Create a Home Valuation Report for This Property
The Home Valuation Report is an in-depth analysis detailing your home's value as well as a comparison with similar homes in the area
Home Values in the Area
Average Home Value in this Area
Purchase History
| Date | Buyer | Sale Price | Title Company |
|---|---|---|---|
| Christensen Danielle M | -- | None Available | |
| Kelly Michael A | -- | -- | |
| Callies Tricia A | -- | -- |
Source: Public Records
Mortgage History
| Date | Status | Borrower | Loan Amount |
|---|---|---|---|
| Closed | Kelly Michael A | $43,000 | |
| Previous Owner | Callies Tricia A | $141,920 |
Source: Public Records
Tax History Compared to Growth
Tax History
| Year | Tax Paid | Tax Assessment Tax Assessment Total Assessment is a certain percentage of the fair market value that is determined by local assessors to be the total taxable value of land and additions on the property. | Land | Improvement |
|---|---|---|---|---|
| 2025 | $643 | $350,689 | $1,000 | $349,689 |
| 2024 | $1,012 | $317,785 | $1,000 | $316,785 |
| 2023 | $948 | $352,984 | $1,000 | $351,984 |
| 2022 | $942 | $370,583 | $1,000 | $369,583 |
| 2021 | $1,239 | $262,152 | $1,000 | $261,152 |
| 2020 | $920 | $193,131 | $1,000 | $192,131 |
| 2019 | $1,036 | $181,228 | $1,000 | $180,228 |
| 2018 | $1,055 | $164,816 | $1,000 | $163,816 |
| 2017 | $976 | $139,035 | $1,000 | $138,035 |
| 2016 | $879 | $117,174 | $1,000 | $116,174 |
| 2015 | $1,721 | $118,525 | $1,000 | $117,525 |
| 2013 | $832 | $98,090 | $1,000 | $97,090 |
Source: Public Records
Map
Nearby Homes
- 1118 W Willow Lake Loop
- 1124 W Willow Lake Loop
- 1154 W Willow Lake Loop
- 863 W Willow Lake Loop
- 1233 W Sycamore Ave
- 6800 N Spurwing Loop
- 6800 N Spurwing Loop Unit 201
- 1232 W Grove Way
- 1274 W Grove Way
- 1007 W Grove Way Unit 102
- 954, ++ W Grove Way
- 6767 N Gavin Loop
- 6235 N Sunrise Terrace
- 500 W Twilight Ct
- 6714 N Calispel Dr
- 5723 N Christopher Dr
- 7384 N Wheatfield Dr
- 7488 N Wheatfield Dr
- 7823 N Girard Cir
- 7736 N Girard Cir
- 6630 N Spurwing Loop Unit 207
- 6630 N Spurwing Loop Unit 206
- 6630 N Spurwing Loop Unit 104
- 6630 N Spurwing Loop Unit 204
- 6630 N Spurwing Loop Unit 106
- 6630 N Spurwing Loop Unit 202
- 6630 N Spurwing Loop Unit 201
- 6630 N Spurwing Loop Unit 102
- 6630 N Spurwing Loop Unit 302
- 6630 N Spurwing Loop Unit 305
- 6630 N Spurwing Loop Unit 203
- 6630 N Spurwing Loop Unit 200
- 6630 N Spurwing Loop Unit 304
- 6630 N Spurwing Loop Unit 205
- 6630 Spurwing Circle 207
- 6630 Spurwing Circle #302
- 6630 N Spurwing Loop
- 6630 Spurwing Loop Unit 305
- 1095 W Willow Lake Loop
- 1113 W Willow Lake Loop