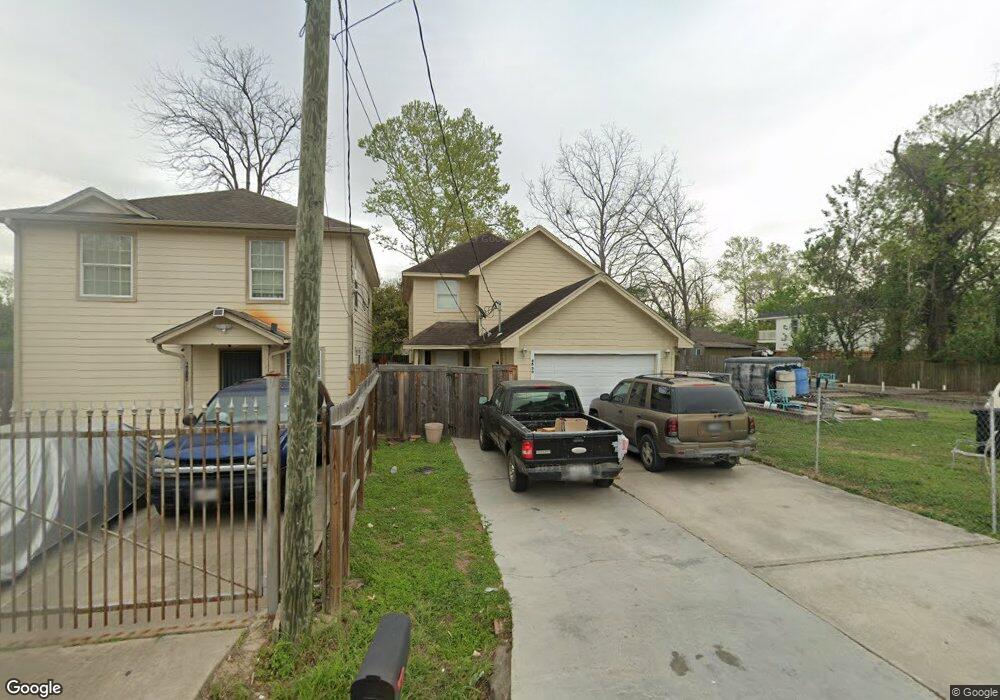
6630 Tuskegee St Houston, TX 77091
Acres Homes NeighborhoodEstimated Value: $61,000 - $275,512
3
Beds
4
Baths
1,600
Sq Ft
$107/Sq Ft
Est. Value
About This Home
This home is located at 6630 Tuskegee St, Houston, TX 77091 and is currently estimated at $171,128, approximately $106 per square foot. 6630 Tuskegee St is a home located in Harris County with nearby schools including Highland Heights Elementary School, Williams Middle, and Booker T Washington Sr High.
Ownership History
Date
Name
Owned For
Owner Type
Purchase Details
Closed on
Jul 23, 2019
Sold by
Sierra Vanessa L
Bought by
Ponce Ana L
Current Estimated Value
Purchase Details
Closed on
Aug 14, 2018
Sold by
Ponce Ana L
Bought by
Sierra Vanessa L and International Bonding Co
Purchase Details
Closed on
Apr 16, 2012
Sold by
Acebo Jonathan and Acebo Bysmark
Bought by
Ponce Lorena
Purchase Details
Closed on
Apr 18, 2008
Sold by
Acebo Bysmark and Acebo Carmen
Bought by
Acebo Jonathan
Purchase Details
Closed on
Apr 11, 2008
Sold by
Acebo Jonathan
Bought by
Acebo Bysmark and Acebo Carmen
Purchase Details
Closed on
Jan 12, 2007
Sold by
Land Assemblage Redevelopment Authority
Bought by
Acebo Bysmark
Purchase Details
Closed on
Apr 4, 2006
Sold by
Shaw Mary and Harris County
Bought by
Land Assemblage Redevelopment Authority
Purchase Details
Closed on
Sep 20, 2005
Sold by
Shaw Mary
Bought by
Murphy Ii Robert
Create a Home Valuation Report for This Property
The Home Valuation Report is an in-depth analysis detailing your home's value as well as a comparison with similar homes in the area
Home Values in the Area
Average Home Value in this Area
Purchase History
| Date | Buyer | Sale Price | Title Company |
|---|---|---|---|
| Ponce Ana L | -- | None Available | |
| Sierra Vanessa L | -- | None Available | |
| Ponce Lorena | -- | None Available | |
| Acebo Jonathan | -- | Stewart Title | |
| Acebo Bysmark | -- | Stewart Title | |
| Acebo Bysmark | -- | None Available | |
| Land Assemblage Redevelopment Authority | $10,000 | None Available | |
| Murphy Ii Robert | -- | None Available |
Source: Public Records
Tax History Compared to Growth
Tax History
| Year | Tax Paid | Tax Assessment Tax Assessment Total Assessment is a certain percentage of the fair market value that is determined by local assessors to be the total taxable value of land and additions on the property. | Land | Improvement |
|---|---|---|---|---|
| 2025 | $1,024 | $48,938 | $45,000 | $3,938 |
| 2024 | $1,024 | $48,938 | $45,000 | $3,938 |
| 2023 | $1,024 | $48,938 | $45,000 | $3,938 |
| 2022 | $813 | $36,938 | $33,000 | $3,938 |
| 2021 | $669 | $28,688 | $24,750 | $3,938 |
| 2020 | $459 | $18,938 | $15,000 | $3,938 |
| 2019 | $251 | $9,938 | $6,900 | $3,038 |
| 2018 | $251 | $9,938 | $6,900 | $3,038 |
| 2017 | $251 | $9,938 | $6,900 | $3,038 |
| 2016 | $251 | $9,938 | $6,900 | $3,038 |
| 2015 | $255 | $9,938 | $6,000 | $3,938 |
| 2014 | $255 | $9,938 | $6,000 | $3,938 |
Source: Public Records
Map
Nearby Homes
- 6729 Arabella St
- 6727 Utah St
- 6726 W Montgomery Rd
- 6719 Utah St
- 6616 Apollo St
- 6710 Utah St
- 6718 Utah St
- 6822 Tuskegee St
- 6723 Cohn St
- 6607 Apollo St
- 0 Utah St Unit 15832092
- 6733 Cohn St
- 7014 W Montgomery Rd
- 6524 Couch St
- 6519 Utah St
- 6510 Arabella St
- 6510 Tuskegee St
- TBD-01-01 Wheatley St
- 6601 Wheatley St
- 6729 Knox St
- 6630 Tuskegee St
- 6634 Tuskegee St
- 6635 Tuskegee St
- 6660 Tuskegee St
- 6637 Tuskegee St
- 6647 Arabella St
- 6626 Tuskegee St
- 6636 Arabella St
- 6804 Arabella St Unit A
- 6804 Arabella St Unit B
- 000 Arabella St
- 6804 Arabella St
- 6633 Tuskegee St
- 6614 Tuskegee St
- 6633 Arabella St
- 7229 W Montgomery Rd
- 6733 Arabella St
- 6627 Arabella St
- 6722 Arabella St
- 6616 Couch St