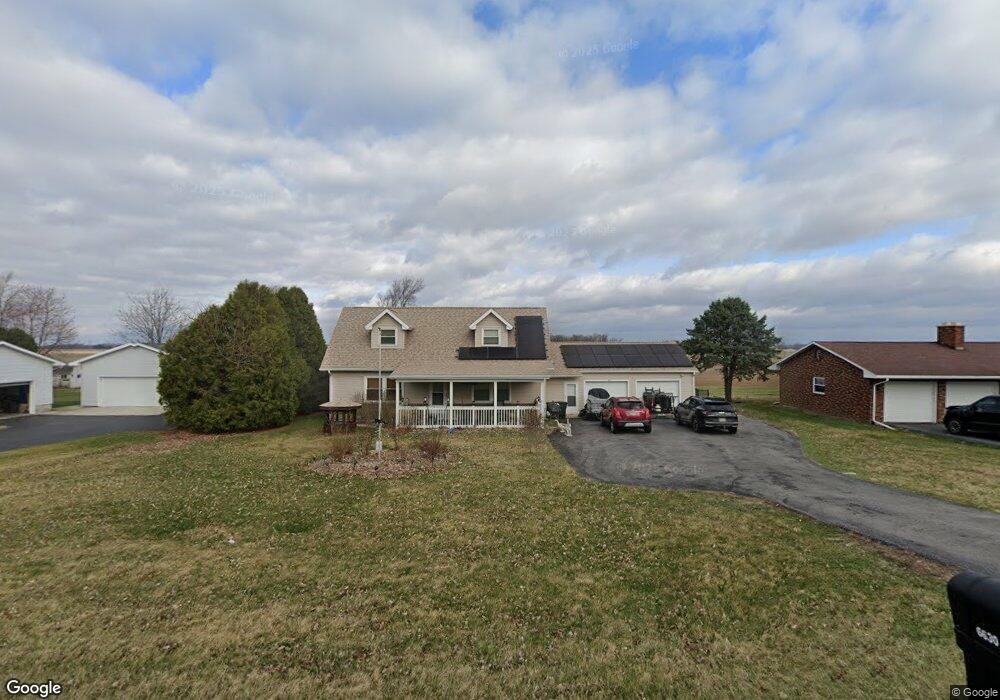
6630 W State Route 12 Findlay, OH 45840
Estimated Value: $236,229 - $262,000
3
Beds
1
Bath
1,300
Sq Ft
$193/Sq Ft
Est. Value
About This Home
This home is located at 6630 W State Route 12, Findlay, OH 45840 and is currently estimated at $250,557, approximately $192 per square foot. 6630 W State Route 12 is a home located in Hancock County with nearby schools including Liberty-Benton Elementary School, Liberty-Benton Middle School, and Liberty-Benton High School.
Ownership History
Date
Name
Owned For
Owner Type
Purchase Details
Closed on
Mar 13, 2025
Sold by
Hershberger Dianna
Bought by
Hershberger Thomas M
Current Estimated Value
Purchase Details
Closed on
Apr 24, 2015
Sold by
Smith James F and Smith Kathy
Bought by
Hershberger Thomas M and Hershberger Dianna
Home Financials for this Owner
Home Financials are based on the most recent Mortgage that was taken out on this home.
Original Mortgage
$150,228
Interest Rate
3.85%
Mortgage Type
FHA
Purchase Details
Closed on
Jan 8, 2014
Sold by
Fannie Mae
Bought by
Smith James E
Purchase Details
Closed on
Oct 30, 2013
Sold by
Miles Cheryl A
Bought by
Federal National Mortgage Association
Purchase Details
Closed on
Jun 2, 1988
Bought by
Miles Steven L and Miles Cheryl L
Create a Home Valuation Report for This Property
The Home Valuation Report is an in-depth analysis detailing your home's value as well as a comparison with similar homes in the area
Home Values in the Area
Average Home Value in this Area
Purchase History
| Date | Buyer | Sale Price | Title Company |
|---|---|---|---|
| Hershberger Thomas M | -- | Whitman Title | |
| Hershberger Thomas M | $150,233 | Federation Escrow & Title Ll | |
| Smith James E | $33,000 | Source One Title | |
| Federal National Mortgage Association | $24,000 | None Available | |
| Miles Steven L | $5,500 | -- |
Source: Public Records
Mortgage History
| Date | Status | Borrower | Loan Amount |
|---|---|---|---|
| Previous Owner | Hershberger Thomas M | $150,228 |
Source: Public Records
Tax History Compared to Growth
Tax History
| Year | Tax Paid | Tax Assessment Tax Assessment Total Assessment is a certain percentage of the fair market value that is determined by local assessors to be the total taxable value of land and additions on the property. | Land | Improvement |
|---|---|---|---|---|
| 2024 | $2,250 | $59,230 | $12,080 | $47,150 |
| 2023 | $2,199 | $59,230 | $12,080 | $47,150 |
| 2022 | $2,178 | $59,230 | $12,080 | $47,150 |
| 2021 | $2,300 | $55,310 | $12,400 | $42,910 |
| 2020 | $2,320 | $55,310 | $12,400 | $42,910 |
| 2019 | $2,230 | $55,310 | $12,400 | $42,910 |
| 2018 | $1,762 | $48,100 | $10,780 | $37,320 |
| 2017 | $1,818 | $48,100 | $10,780 | $37,320 |
| 2016 | $1,775 | $48,100 | $10,780 | $37,320 |
| 2015 | $1,416 | $37,540 | $11,170 | $26,370 |
| 2014 | $1,429 | $37,540 | $11,170 | $26,370 |
| 2012 | $1,450 | $37,540 | $11,170 | $26,370 |
Source: Public Records
Map
Nearby Homes
- 9984 State Route 235
- 11741 Township Road 10
- 7780 Township Road 89
- 12159 County Road 12
- 10601 County Road 9
- 9307 W State Route 12
- 4516 W US Route 224
- 9653 Early Dr
- 9307 Hiegel Dr
- 13666 County Road 12
- 3833 Bearcat Way
- 11526 Township Road 122
- 2201 W Main Cross St
- 0 Bushwillow Dr Unit Lot 154
- 0 Bushwillow Dr Lot 156 Unit 6079046
- 0 Rock Candy Rd Lot 162 Unit 6079070
- 0 Bushwillow Dr Unit Lot 156
- 0 Bearcat Way Or 0 Rock Candy Rd Lot 167 Unit 6079083
- 0 Bushwillow Dr Lot 154 Unit 6079043
- 0 Rock Candy Rd Lot 171 Unit 6079088
- 6630 Ohio 12
- 6638 W State Route 12
- 6602 W State Route 12
- 6634 Ohio 12
- 6570 W State Route 12
- 6619 W State Route 12
- 6570 Ohio 12
- 6637 W State Route 12
- 6601 W State Route 12
- 6601 W State Route 12
- 6656 W State Route 12
- 6656 Ohio 12
- 6645 W State Route 12
- 6560 W State Route 12
- 6575 W State Route 12
- 6663 W State Route 12
- 6565 W State Route 12
- 6639 W State Route 12
- 6681 W State Route 12
- 6686 Ohio 12