6631 S Humphrey Rd Clinton, WA 98236
Estimated Value: $692,000 - $773,000
3
Beds
3
Baths
2,061
Sq Ft
$353/Sq Ft
Est. Value
About This Home
This home is located at 6631 S Humphrey Rd, Clinton, WA 98236 and is currently estimated at $727,463, approximately $352 per square foot. 6631 S Humphrey Rd is a home located in Island County with nearby schools including South Whidbey Elementary School, South Whidbey Middle School, and South Whidbey High School.
Ownership History
Date
Name
Owned For
Owner Type
Purchase Details
Closed on
Aug 26, 2025
Sold by
Robert And Constance Lovell Living Trust and Lovell Robert Walter
Bought by
Moriya Shiroh and Mcmahill Cheiron Sariko
Current Estimated Value
Home Financials for this Owner
Home Financials are based on the most recent Mortgage that was taken out on this home.
Original Mortgage
$616,500
Outstanding Balance
$616,500
Interest Rate
6.75%
Mortgage Type
New Conventional
Estimated Equity
$110,963
Purchase Details
Closed on
Jul 19, 2017
Sold by
Driscoll Patrick R and Driscoll Laura Y
Bought by
Lovell Robert Walter and Lovell Constance J
Home Financials for this Owner
Home Financials are based on the most recent Mortgage that was taken out on this home.
Original Mortgage
$258,300
Interest Rate
3.89%
Mortgage Type
New Conventional
Create a Home Valuation Report for This Property
The Home Valuation Report is an in-depth analysis detailing your home's value as well as a comparison with similar homes in the area
Home Values in the Area
Average Home Value in this Area
Purchase History
| Date | Buyer | Sale Price | Title Company |
|---|---|---|---|
| Moriya Shiroh | $685,000 | Chicago Title | |
| Lovell Robert Walter | $369,000 | Premier Title Of Island |
Source: Public Records
Mortgage History
| Date | Status | Borrower | Loan Amount |
|---|---|---|---|
| Open | Moriya Shiroh | $616,500 | |
| Previous Owner | Lovell Robert Walter | $258,300 |
Source: Public Records
Tax History Compared to Growth
Tax History
| Year | Tax Paid | Tax Assessment Tax Assessment Total Assessment is a certain percentage of the fair market value that is determined by local assessors to be the total taxable value of land and additions on the property. | Land | Improvement |
|---|---|---|---|---|
| 2024 | $4,409 | $670,006 | $300,000 | $370,006 |
| 2023 | $4,409 | $674,620 | $300,000 | $374,620 |
| 2022 | $4,223 | $623,410 | $280,000 | $343,410 |
| 2021 | $3,314 | $532,241 | $230,000 | $302,241 |
| 2020 | $3,242 | $424,299 | $180,000 | $244,299 |
| 2019 | $2,584 | $426,169 | $240,000 | $186,169 |
| 2018 | $2,795 | $336,743 | $150,000 | $186,743 |
| 2017 | $2,174 | $337,887 | $150,000 | $187,887 |
| 2016 | $2,260 | $287,138 | $100,000 | $187,138 |
| 2015 | $2,344 | $289,392 | $100,000 | $189,392 |
| 2013 | -- | $293,538 | $100,000 | $193,538 |
Source: Public Records
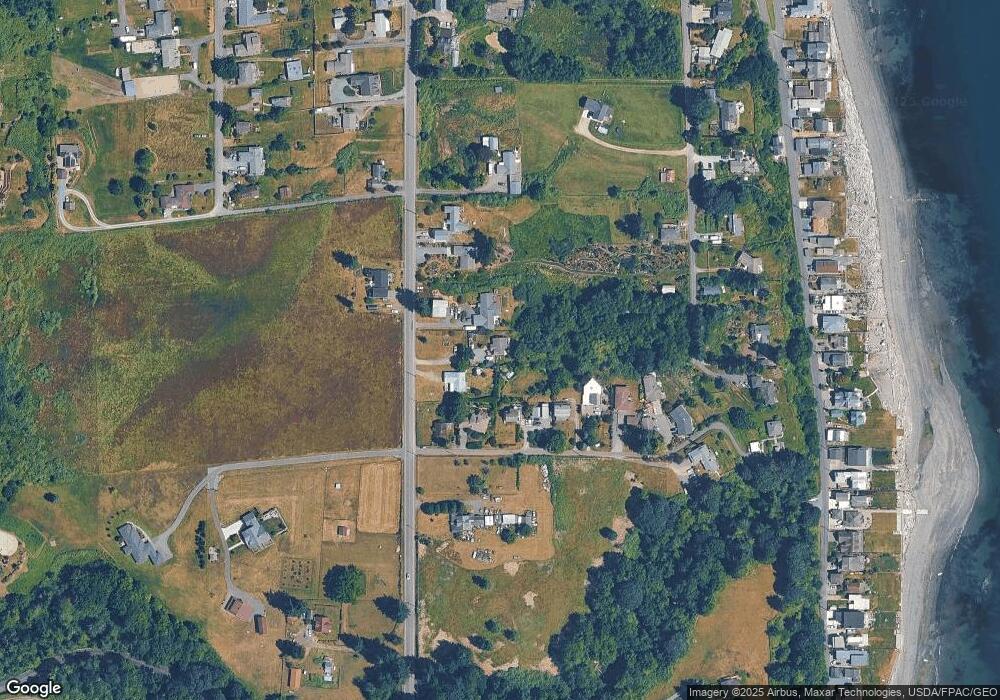
Map
Nearby Homes
- 4849 Berg Rd
- 4849 E Berg Rd
- 9265 Washington 525
- 4913 Marshall Rd
- 4635 Cherrystone Ln
- 0 E Heggeness Rd
- 4621 Deer Lake Rd
- 4480 Hilltop Dr
- 6248 Spinnaker Ridge Ln
- 9546 Washington 525
- 4441 Forgotten Ln
- 0 S Twin Cedars Dr
- 0 Lot 85 Skyview Dr
- 0 Lot 86 Skyview Dr
- 0 Xxx Hilltop Dr
- 4324 Shadowood Dr
- 6255 Turkey Hill Rd
- 6902 Holst Rd
- 4141 Timberline Rd
- 4130 Frog Water Rd
- 6639 Humphrey Rd
- 6625 Humphrey Rd
- 6623 Humphrey Rd
- 4813 Gedney View Ln
- 4823 Gedney View Ln
- 6615 Humphrey Rd
- 4809 Gedney View Ln
- 4831 Gedney View Ln
- 6618 Humphrey Rd
- 4835 Gedney View Ln
- 6605 Humphrey Rd
- 6671 Humphrey Rd
- 4841 Gedney View Ln
- 4847 Gedney View Ln
- 6591 Humphrey Rd
- 6602 Humphrey Rd
- 4847 E Gedney View Ln
- 6598 Humphrey Rd
- 4855 Gedney View Ln
- 6607 Conrad St