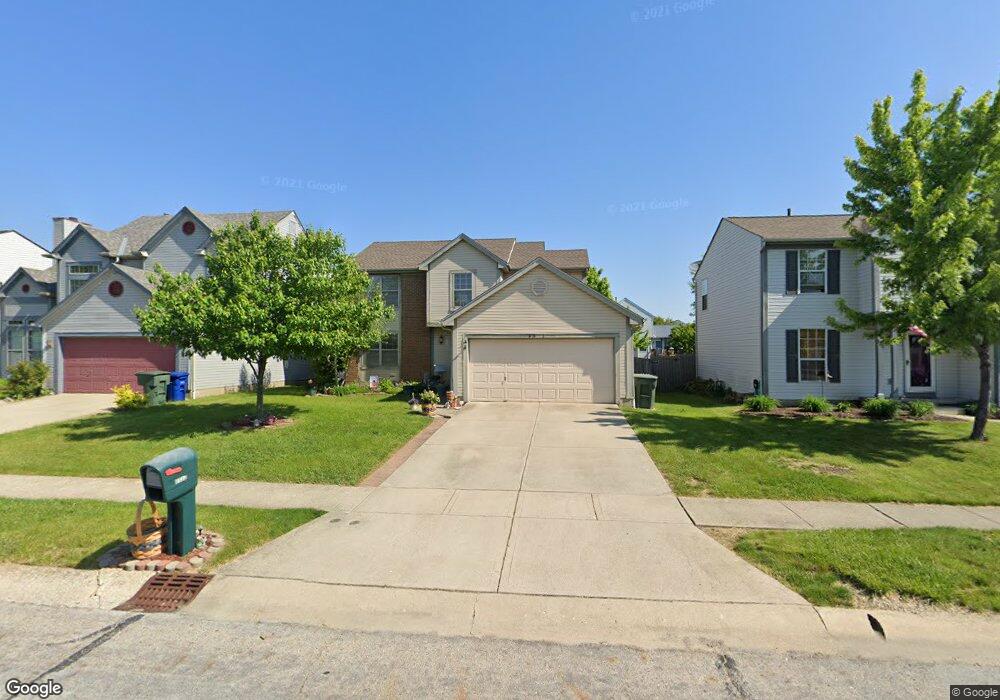
6632 Fallon Ln Canal Winchester, OH 43110
East Columbus-White Ash NeighborhoodEstimated Value: $302,000 - $362,000
4
Beds
3
Baths
2,630
Sq Ft
$124/Sq Ft
Est. Value
About This Home
This home is located at 6632 Fallon Ln, Canal Winchester, OH 43110 and is currently estimated at $327,144, approximately $124 per square foot. 6632 Fallon Ln is a home located in Franklin County with nearby schools including Winchester Trail Elementary School, Indian Trail Elementary School, and Canal Winchester Middle School.
Ownership History
Date
Name
Owned For
Owner Type
Purchase Details
Closed on
Aug 14, 2008
Sold by
Stewart Frank L and Stewart Betty J
Bought by
Roff Jerrold A and Roff Charlotte L
Current Estimated Value
Home Financials for this Owner
Home Financials are based on the most recent Mortgage that was taken out on this home.
Original Mortgage
$138,150
Outstanding Balance
$90,938
Interest Rate
6.39%
Mortgage Type
FHA
Estimated Equity
$236,206
Purchase Details
Closed on
May 19, 1997
Sold by
Trinity Home Builders Inc
Bought by
Stewart Frank L
Home Financials for this Owner
Home Financials are based on the most recent Mortgage that was taken out on this home.
Original Mortgage
$123,900
Interest Rate
8%
Mortgage Type
VA
Purchase Details
Closed on
Oct 20, 1995
Sold by
Homewood Corp
Bought by
Trinity Home Builders Inc
Create a Home Valuation Report for This Property
The Home Valuation Report is an in-depth analysis detailing your home's value as well as a comparison with similar homes in the area
Home Values in the Area
Average Home Value in this Area
Purchase History
| Date | Buyer | Sale Price | Title Company |
|---|---|---|---|
| Roff Jerrold A | $140,000 | Foundation | |
| Stewart Frank L | $120,700 | Preferred Title Agency Inc | |
| Trinity Home Builders Inc | $38,046 | -- |
Source: Public Records
Mortgage History
| Date | Status | Borrower | Loan Amount |
|---|---|---|---|
| Open | Roff Jerrold A | $138,150 | |
| Closed | Stewart Frank L | $123,900 |
Source: Public Records
Tax History Compared to Growth
Tax History
| Year | Tax Paid | Tax Assessment Tax Assessment Total Assessment is a certain percentage of the fair market value that is determined by local assessors to be the total taxable value of land and additions on the property. | Land | Improvement |
|---|---|---|---|---|
| 2024 | $4,719 | $97,730 | $23,280 | $74,450 |
| 2023 | $4,691 | $97,720 | $23,275 | $74,445 |
| 2022 | $3,291 | $60,380 | $12,780 | $47,600 |
| 2021 | $3,328 | $60,380 | $12,780 | $47,600 |
| 2020 | $3,315 | $60,380 | $12,780 | $47,600 |
| 2019 | $3,051 | $47,670 | $10,220 | $37,450 |
| 2018 | $2,925 | $47,670 | $10,220 | $37,450 |
| 2017 | $2,924 | $47,670 | $10,220 | $37,450 |
| 2016 | $2,865 | $42,740 | $7,700 | $35,040 |
| 2015 | $2,874 | $42,740 | $7,700 | $35,040 |
| 2014 | $2,873 | $42,740 | $7,700 | $35,040 |
| 2013 | $1,500 | $45,010 | $8,120 | $36,890 |
Source: Public Records
Map
Nearby Homes
- 6697 Fallon Ln
- 6737 Fallon Ln
- 6754 Kristins Cove Ln
- 5777 Winshire Dr
- 6802 Kristins Cove Ln
- 6715 Alex Dr
- 6723 Alex Dr
- 6786 Warriner Way
- 5422 Wrigley St
- 0 Lehman Rd Unit 225027581
- 0 Lehman Rd Unit 225021076
- 560 Winchester Pike
- 6947 Storm Boat Ln
- 7061 Selva Trail Dr
- 5493 Meadow Passage Dr
- 6773 Laburnum Dr
- 5708 Canal Bridge Dr
- 5718 Orchard Lakes Trail Dr
- 5712 Orchard Lakes Trail Dr
- 6790 Laburnum Dr
- 6638 Fallon Ln
- 6626 Fallon Ln
- 6620 Fallon Ln
- 6644 Fallon Ln
- 6631 Cloverlawn Cir
- 6637 Cloverlawn Cir
- 6625 Cloverlawn Cir
- 6614 Fallon Ln
- 6650 Fallon Ln
- 6643 Cloverlawn Cir
- 6619 Cloverlawn Cir
- 6633 Fallon Ln
- 6625 Fallon Ln
- 6639 Fallon Ln
- 6619 Fallon Ln
- 6649 Cloverlawn Cir
- 6613 Cloverlawn Cir
- 6608 Fallon Ln
- 6656 Fallon Ln
- 6645 Fallon Ln