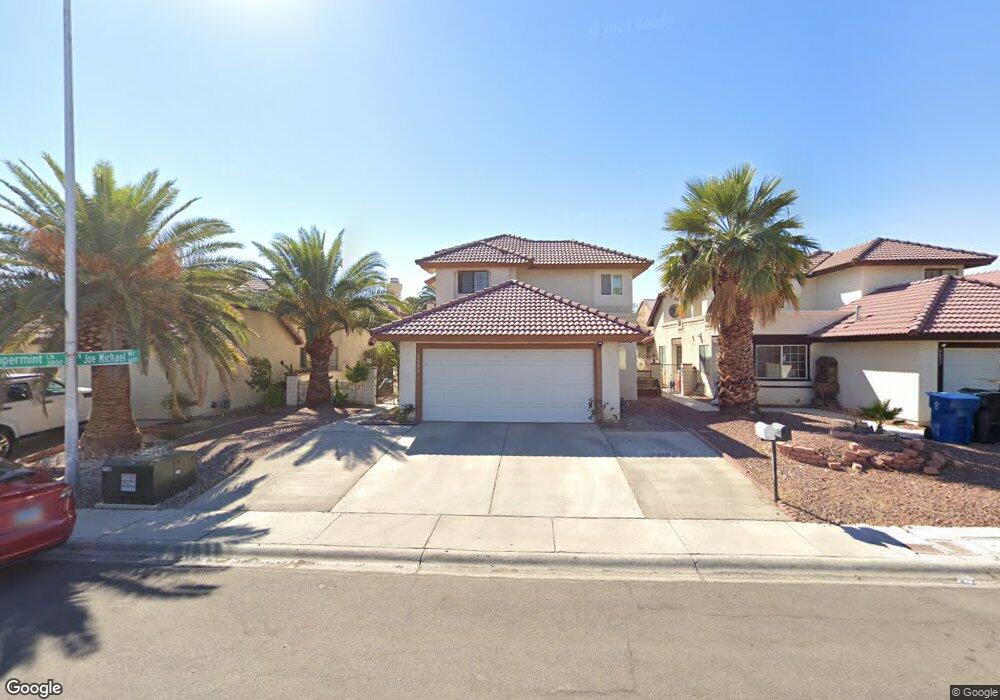
6633 Joe Michael Way Las Vegas, NV 89108
Woodcrest NeighborhoodEstimated Value: $394,246 - $437,000
5
Beds
3
Baths
1,861
Sq Ft
$222/Sq Ft
Est. Value
About This Home
This home is located at 6633 Joe Michael Way, Las Vegas, NV 89108 and is currently estimated at $412,562, approximately $221 per square foot. 6633 Joe Michael Way is a home located in Clark County with nearby schools including R.E. Tobler Elementary School, Irwin & Susan Molasky Junior High School, and Cheyenne High School.
Ownership History
Date
Name
Owned For
Owner Type
Purchase Details
Closed on
Dec 11, 2019
Sold by
Chavarria Noel and Chavarria Noel O
Bought by
Chavarria Noel
Current Estimated Value
Home Financials for this Owner
Home Financials are based on the most recent Mortgage that was taken out on this home.
Original Mortgage
$123,500
Outstanding Balance
$84,026
Interest Rate
3.7%
Mortgage Type
New Conventional
Estimated Equity
$328,536
Purchase Details
Closed on
Sep 23, 2014
Sold by
Chavarria Vicenta
Bought by
Chavarria Noel O
Home Financials for this Owner
Home Financials are based on the most recent Mortgage that was taken out on this home.
Original Mortgage
$133,000
Interest Rate
4.09%
Mortgage Type
New Conventional
Purchase Details
Closed on
Sep 22, 2014
Sold by
Parkins Kieth W
Bought by
Chavarria Noel O
Home Financials for this Owner
Home Financials are based on the most recent Mortgage that was taken out on this home.
Original Mortgage
$133,000
Interest Rate
4.09%
Mortgage Type
New Conventional
Purchase Details
Closed on
Sep 11, 2012
Sold by
Parkins Keith W
Bought by
Parkins Kieth W and Keith W Parksin Revocable Trust
Purchase Details
Closed on
Jul 9, 2010
Sold by
Aurora Loan Services Llc
Bought by
Parkins Kieth W
Home Financials for this Owner
Home Financials are based on the most recent Mortgage that was taken out on this home.
Original Mortgage
$73,000
Interest Rate
4.79%
Mortgage Type
New Conventional
Purchase Details
Closed on
Apr 23, 2010
Sold by
Keo Hakleng
Bought by
Aurora Loan Services Llc
Purchase Details
Closed on
Feb 7, 2006
Sold by
Keo Chantha
Bought by
Keo Hakleng
Purchase Details
Closed on
Jun 15, 2004
Sold by
Spartan Management Group Llc
Bought by
Keo Hakleng and Keo Chantha
Home Financials for this Owner
Home Financials are based on the most recent Mortgage that was taken out on this home.
Original Mortgage
$222,700
Interest Rate
6.12%
Mortgage Type
Unknown
Purchase Details
Closed on
Mar 18, 2004
Sold by
Walkerow Arthur and Walkerow Clara
Bought by
Spartan Management Group Llc
Purchase Details
Closed on
Jun 5, 1995
Sold by
Mccarthy John P and Mccarthy Margaret A
Bought by
Walkerow Arthur L and Walkerow Clara J
Home Financials for this Owner
Home Financials are based on the most recent Mortgage that was taken out on this home.
Original Mortgage
$127,000
Interest Rate
7.59%
Mortgage Type
Assumption
Create a Home Valuation Report for This Property
The Home Valuation Report is an in-depth analysis detailing your home's value as well as a comparison with similar homes in the area
Home Values in the Area
Average Home Value in this Area
Purchase History
| Date | Buyer | Sale Price | Title Company |
|---|---|---|---|
| Chavarria Noel | -- | Lawyers Title Of Nevada C | |
| Chavarria Noel | -- | Lawyers Title Of Nevada C | |
| Chavarria Noel O | -- | Ticor Title Las Vegas | |
| Chavarria Noel O | $140,000 | Ticor Title Las Vegas | |
| Parkins Kieth W | -- | None Available | |
| Parkins Kieth W | $108,000 | Ticor Title Las Vegas | |
| Parkins Kieth W | $108,000 | Ticor Title Las Vegas | |
| Aurora Loan Services Llc | $87,500 | Servicelink Irvine | |
| Keo Hakleng | -- | Fidelity National Title | |
| Keo Hakleng | -- | Fidelity National Title | |
| Keo Hakleng | $262,000 | First American Title Co Of | |
| Spartan Management Group Llc | $123,550 | -- | |
| Walkerow Arthur L | $127,000 | Fidelity National Title |
Source: Public Records
Mortgage History
| Date | Status | Borrower | Loan Amount |
|---|---|---|---|
| Open | Chavarria Noel | $123,500 | |
| Closed | Chavarria Noel O | $133,000 | |
| Previous Owner | Parkins Kieth W | $73,000 | |
| Previous Owner | Keo Hakleng | $222,700 | |
| Previous Owner | Walkerow Arthur L | $127,000 |
Source: Public Records
Tax History Compared to Growth
Tax History
| Year | Tax Paid | Tax Assessment Tax Assessment Total Assessment is a certain percentage of the fair market value that is determined by local assessors to be the total taxable value of land and additions on the property. | Land | Improvement |
|---|---|---|---|---|
| 2025 | $1,498 | $72,974 | $27,300 | $45,674 |
| 2024 | $1,455 | $72,974 | $27,300 | $45,674 |
| 2023 | $1,153 | $74,002 | $30,100 | $43,902 |
| 2022 | $1,412 | $64,320 | $23,800 | $40,520 |
| 2021 | $1,371 | $59,957 | $21,000 | $38,957 |
| 2020 | $1,328 | $59,291 | $20,300 | $38,991 |
| 2019 | $1,290 | $55,206 | $16,450 | $38,756 |
| 2018 | $1,231 | $52,144 | $14,700 | $37,444 |
| 2017 | $1,679 | $51,215 | $12,950 | $38,265 |
| 2016 | $1,153 | $47,937 | $9,100 | $38,837 |
| 2015 | $1,150 | $41,028 | $6,300 | $34,728 |
| 2014 | $1,116 | $33,032 | $8,750 | $24,282 |
Source: Public Records
Map
Nearby Homes
- 6656 Joe Michael Way
- 6660 Joe Michael Way
- 6700 Amarinta Ave Unit 103
- 3805 Twig Ln
- 6800 Dorita Ave Unit 202
- 6604 Chardonay Way
- 6645 Telegraph Rd
- 3601 Spanish Butterfly St Unit 202
- 3609 Pintadas St Unit 202
- 3813 Marshall Cir
- 3609 Galatea St Unit 102
- 3740 Broadriver Dr
- 6617 Beacon Rd
- 6709 Cobre Azul Ave Unit 102
- 6809 Cobre Azul Ave Unit 202
- 6800 Elm Creek Dr Unit 103
- 3909 Rhine Way Unit 2
- 6920 Senton Ave
- 3621 Broxburn St
- 6808 Elm Creek Dr Unit 203
- 6637 Joe Michael Way
- 6629 Joe Michael Way
- 6641 Joe Michael Way
- 6625 Joe Michael Way
- 6632 Crosstimber Ct
- 6628 Crosstimber Ct
- 6628 Crosstimber Ct
- 6628 Crosstimber Ct
- 6636 Crosstimber Ct
- 6645 Joe Michael Way
- 6621 Joe Michael Way Unit none
- 6621 Joe Michael Way
- 6636 W Crosstimber Ct
- 6624 Crosstimber Ct
- 6640 Crosstimber Ct
- 6620 Crosstimber Ct
- 6617 Joe Michael Way
- 6649 Joe Michael Way
- 6636 Joe Michael Way Unit n/a
- 6636 Joe Michael Way