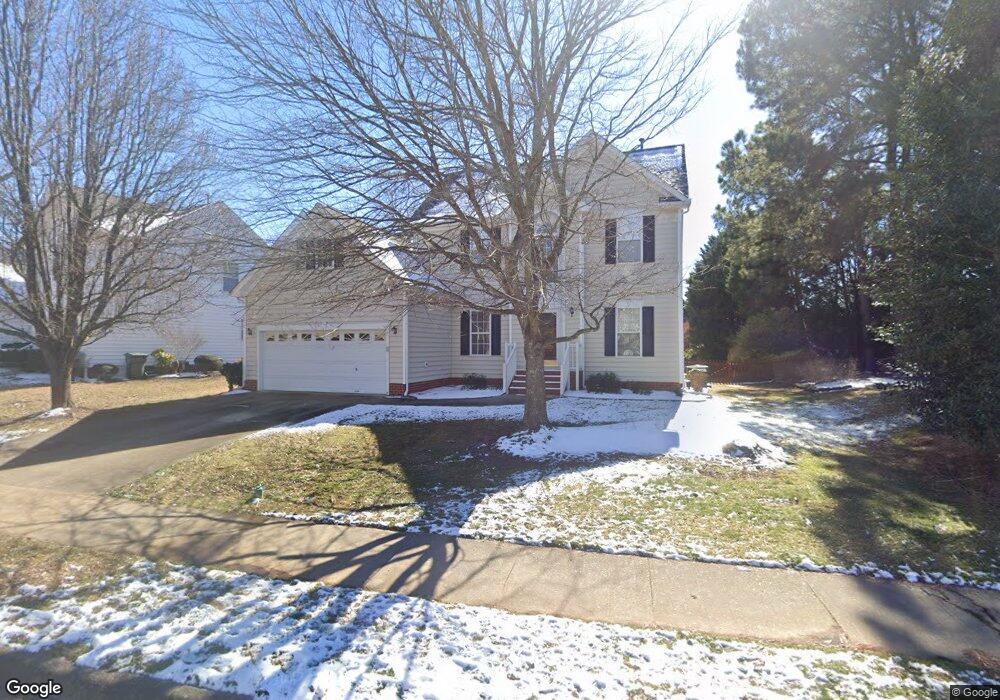
6633 Lewey Dr Cary, NC 27519
West Cary NeighborhoodEstimated Value: $596,000 - $630,534
3
Beds
3
Baths
2,267
Sq Ft
$270/Sq Ft
Est. Value
About This Home
This home is located at 6633 Lewey Dr, Cary, NC 27519 and is currently estimated at $612,884, approximately $270 per square foot. 6633 Lewey Dr is a home located in Wake County with nearby schools including Turner Creek Elementary School, Salem Middle, and Green Hope High.
Ownership History
Date
Name
Owned For
Owner Type
Purchase Details
Closed on
Jan 31, 2020
Sold by
White Philip G
Bought by
Paturi Venkata Ratnam and Paturi Anjana Devi
Current Estimated Value
Purchase Details
Closed on
Jul 21, 2000
Sold by
Charmello David C
Bought by
White Philip G and White Jacqueline
Home Financials for this Owner
Home Financials are based on the most recent Mortgage that was taken out on this home.
Original Mortgage
$103,500
Interest Rate
8.12%
Purchase Details
Closed on
Apr 3, 1998
Sold by
Centex Homes
Bought by
Charmello David C and Charmello Kathy A
Home Financials for this Owner
Home Financials are based on the most recent Mortgage that was taken out on this home.
Original Mortgage
$154,500
Interest Rate
7.03%
Create a Home Valuation Report for This Property
The Home Valuation Report is an in-depth analysis detailing your home's value as well as a comparison with similar homes in the area
Home Values in the Area
Average Home Value in this Area
Purchase History
| Date | Buyer | Sale Price | Title Company |
|---|---|---|---|
| Paturi Venkata Ratnam | $325,000 | None Available | |
| Paturi Venkata Ratnam | $325,000 | None Listed On Document | |
| White Philip G | $200,000 | -- | |
| Charmello David C | $193,500 | -- |
Source: Public Records
Mortgage History
| Date | Status | Borrower | Loan Amount |
|---|---|---|---|
| Previous Owner | White Philip G | $103,500 | |
| Previous Owner | Charmello David C | $154,500 | |
| Closed | Charmello David C | $19,300 |
Source: Public Records
Tax History Compared to Growth
Tax History
| Year | Tax Paid | Tax Assessment Tax Assessment Total Assessment is a certain percentage of the fair market value that is determined by local assessors to be the total taxable value of land and additions on the property. | Land | Improvement |
|---|---|---|---|---|
| 2025 | $5,120 | $595,074 | $189,000 | $406,074 |
| 2024 | $5,010 | $595,074 | $189,000 | $406,074 |
| 2023 | $3,771 | $374,328 | $83,000 | $291,328 |
| 2022 | $3,630 | $374,328 | $83,000 | $291,328 |
| 2021 | $3,557 | $374,328 | $83,000 | $291,328 |
| 2020 | $3,576 | $374,328 | $83,000 | $291,328 |
| 2019 | $3,339 | $310,013 | $83,000 | $227,013 |
| 2018 | $3,134 | $310,013 | $83,000 | $227,013 |
| 2017 | $3,012 | $310,013 | $83,000 | $227,013 |
| 2016 | $2,967 | $310,013 | $83,000 | $227,013 |
| 2015 | $3,046 | $307,320 | $78,000 | $229,320 |
| 2014 | $2,872 | $307,320 | $78,000 | $229,320 |
Source: Public Records
Map
Nearby Homes
- 320 Wedgemere St
- 200 Carpenter Brook Dr
- 205 Wedgemere St
- 6716 Valley Woods Ln
- 100 Wentbridge Rd
- 120 Union Mills Way
- 103 Town Creek Dr
- 112 Amiable Loop
- 307 Sir Brennan Ct
- 320 Sutton Glen Dr
- 2021 Patapsco Dr
- 712 Oak Ridge Dr
- 713 Oak Ridge Dr
- 721 Oak Ridge Dr
- 708 Oak Ridge Dr
- 705 Oak Ridge Dr
- 720 Oak Ridge Dr
- 112 Rapport Dr
- 700 Oak Ridge Dr
- 424 Euphoria Cir
- 6631 Lewey Dr
- 602 Park York Ln
- 6629 Lewey Dr
- 6638 Lewey Dr
- 6636 Lewey Dr
- 604 Park York Ln
- 6634 Lewey Dr
- 600 Park York Ln
- 506 Fryar Creek Dr
- 6632 Lewey Dr
- 502 Park York Ln
- 503 Fryar Creek Dr
- 606 Park York Ln
- 504 Fryar Creek Dr
- 6630 Lewey Dr
- 6652 Lewey Dr
- 105 Spindle Creek Ct
- 501 Fryar Creek Dr
- 601 Park York Ln
- 408 Park York Ln