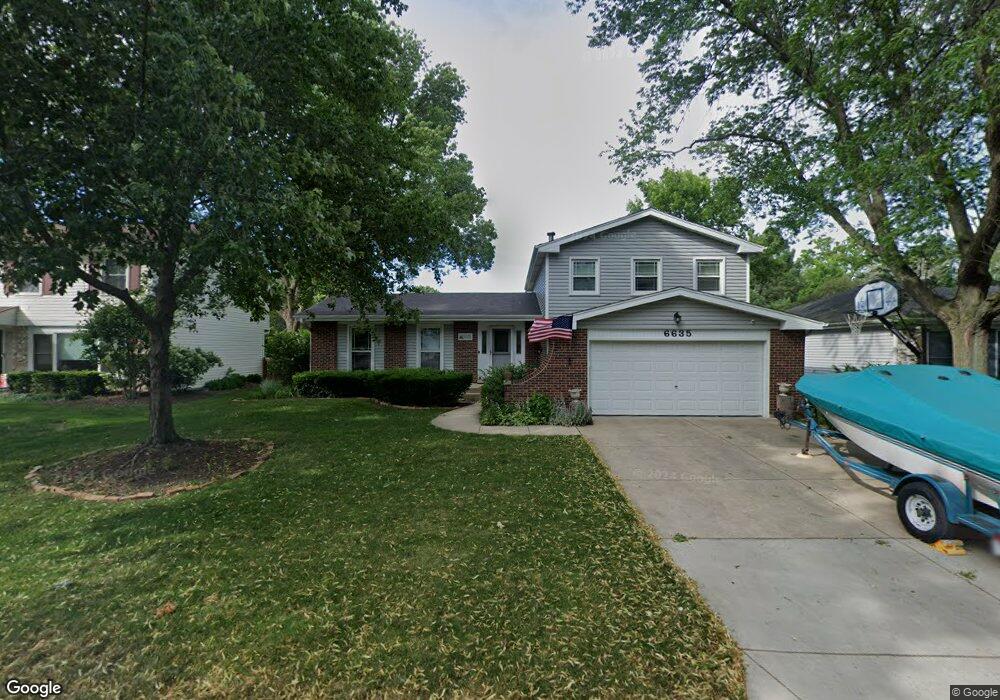
6635 Breckenridge Rd Unit 1 Lisle, IL 60532
Huntington Hill NeighborhoodEstimated Value: $581,489 - $598,000
3
Beds
3
Baths
1,998
Sq Ft
$294/Sq Ft
Est. Value
About This Home
This home is located at 6635 Breckenridge Rd Unit 1, Lisle, IL 60532 and is currently estimated at $588,122, approximately $294 per square foot. 6635 Breckenridge Rd Unit 1 is a home located in DuPage County with nearby schools including Highlands Elementary School, Kennedy Junior High School, and Naperville North High School.
Ownership History
Date
Name
Owned For
Owner Type
Purchase Details
Closed on
Oct 28, 2011
Sold by
Mead Richard J and The Richard J Mead Trust
Bought by
Zafar Asim Muhammad and Zafar Quratulain B
Current Estimated Value
Home Financials for this Owner
Home Financials are based on the most recent Mortgage that was taken out on this home.
Original Mortgage
$248,047
Outstanding Balance
$166,923
Interest Rate
3.75%
Mortgage Type
FHA
Estimated Equity
$421,199
Purchase Details
Closed on
Dec 11, 2002
Sold by
Mead Richard J and Mead Margery P
Bought by
Mead Richard J and Mead Margery P
Purchase Details
Closed on
Mar 17, 1997
Sold by
Lack Roy E and Lack Donna S
Bought by
Mead Richard J and Mead Margery R
Home Financials for this Owner
Home Financials are based on the most recent Mortgage that was taken out on this home.
Original Mortgage
$90,000
Interest Rate
7.62%
Create a Home Valuation Report for This Property
The Home Valuation Report is an in-depth analysis detailing your home's value as well as a comparison with similar homes in the area
Home Values in the Area
Average Home Value in this Area
Purchase History
| Date | Buyer | Sale Price | Title Company |
|---|---|---|---|
| Zafar Asim Muhammad | $254,500 | Ctic | |
| Mead Richard J | -- | -- | |
| Mead Richard J | $189,000 | First American Title |
Source: Public Records
Mortgage History
| Date | Status | Borrower | Loan Amount |
|---|---|---|---|
| Open | Zafar Asim Muhammad | $248,047 | |
| Previous Owner | Mead Richard J | $90,000 |
Source: Public Records
Tax History Compared to Growth
Tax History
| Year | Tax Paid | Tax Assessment Tax Assessment Total Assessment is a certain percentage of the fair market value that is determined by local assessors to be the total taxable value of land and additions on the property. | Land | Improvement |
|---|---|---|---|---|
| 2024 | $10,563 | $156,444 | $71,768 | $84,676 |
| 2023 | $10,208 | $142,780 | $65,500 | $77,280 |
| 2022 | $9,467 | $132,210 | $60,650 | $71,560 |
| 2021 | $9,190 | $127,210 | $58,360 | $68,850 |
| 2020 | $8,987 | $124,920 | $57,310 | $67,610 |
| 2019 | $8,730 | $119,520 | $54,830 | $64,690 |
| 2018 | $8,764 | $119,520 | $54,830 | $64,690 |
| 2017 | $8,614 | $115,490 | $52,980 | $62,510 |
| 2016 | $8,475 | $111,310 | $51,060 | $60,250 |
| 2015 | $8,391 | $104,820 | $48,080 | $56,740 |
| 2014 | $8,215 | $100,790 | $46,230 | $54,560 |
| 2013 | $8,090 | $101,030 | $46,340 | $54,690 |
Source: Public Records
Map
Nearby Homes
- 2651 Yorkshire Ln
- 2671 Longview Dr
- 920 Rockbridge Rd
- 6386 Kindling Ct
- 1386 Old Dominion Ct
- 2880 Torrey Pine Ln Unit 2F
- 1935 Green Trails Dr
- 1216 Tranquility Ct
- 2101 Babst Ct
- 6S503 Bridlespur Dr
- 1131 Overton Ct
- 23W731 Hobson Rd
- 23W711 Hobson Rd
- 23W501 Green Trails Dr
- 7S610 Lynn Dr
- 1778 Briggs Ct
- 1736 Brookwood Rd
- 1228 Elizabeth Ave
- 625 Edward Rd
- 3 Westmoreland Ln
- 6631 Breckenridge Rd
- 6639 Breckenridge Rd
- 6575 Fernwood Dr
- 6627 Breckenridge Rd Unit 1
- 6635 Grenoble Ct Unit 1
- 6579 Fernwood Dr
- 6571 Fernwood Dr
- 6644 Stowe Ct
- 6634 Grenoble Ct Unit 1
- 6632 Stowe Ct Unit 1
- 6638 Stowe Ct
- 6639 Grenoble Ct
- 6587 Fernwood Dr
- 6626 Stowe Ct
- 6599 Fernwood Dr
- 6567 Fernwood Dr
- 6638 Grenoble Ct
- 6595 Fernwood Dr
- 6576 Fernwood Dr
- 6662 Breckenridge Rd