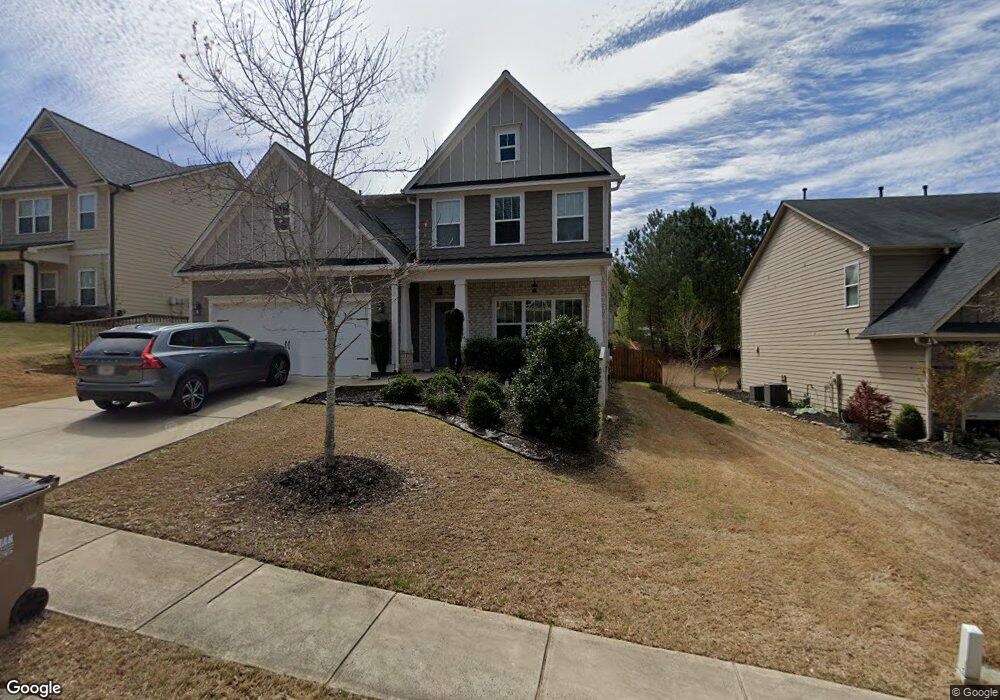
6635 Bridge Stream Rd Cumming, GA 30028
Estimated Value: $568,989 - $576,000
4
Beds
4
Baths
2,926
Sq Ft
$196/Sq Ft
Est. Value
About This Home
This home is located at 6635 Bridge Stream Rd, Cumming, GA 30028 and is currently estimated at $572,247, approximately $195 per square foot. 6635 Bridge Stream Rd is a home located in Forsyth County with nearby schools including Matt Elementary School, Liberty Middle School, and North Forsyth High School.
Ownership History
Date
Name
Owned For
Owner Type
Purchase Details
Closed on
Sep 30, 2021
Sold by
Pulimamdi Shyam Sunder Reddy
Bought by
Pulimamdi Shyam Sunder Reddy and Byreddy Anusha
Current Estimated Value
Home Financials for this Owner
Home Financials are based on the most recent Mortgage that was taken out on this home.
Original Mortgage
$428,560
Outstanding Balance
$390,807
Interest Rate
2.8%
Mortgage Type
New Conventional
Estimated Equity
$181,440
Purchase Details
Closed on
Sep 29, 2017
Sold by
Mazer Jeffrey D
Bought by
Mazer Jeffrey D and Mazer Emma
Home Financials for this Owner
Home Financials are based on the most recent Mortgage that was taken out on this home.
Original Mortgage
$291,783
Interest Rate
3.82%
Mortgage Type
New Conventional
Purchase Details
Closed on
May 18, 2017
Sold by
Parkstone Llc
Bought by
Sharp Residential Llc
Purchase Details
Closed on
Nov 26, 2012
Sold by
Forrest Park Preserve Llc
Bought by
Parkstone Llc
Create a Home Valuation Report for This Property
The Home Valuation Report is an in-depth analysis detailing your home's value as well as a comparison with similar homes in the area
Home Values in the Area
Average Home Value in this Area
Purchase History
| Date | Buyer | Sale Price | Title Company |
|---|---|---|---|
| Pulimamdi Shyam Sunder Reddy | $451,116 | -- | |
| Pulimamdi Shyam Sunder Reddy | $451,116 | -- | |
| Mazer Jeffrey D | $307,141 | -- | |
| Mazer Jeffrey D | $307,141 | -- | |
| Sharp Residential Llc | $31,000 | -- | |
| Parkstone Llc | -- | -- |
Source: Public Records
Mortgage History
| Date | Status | Borrower | Loan Amount |
|---|---|---|---|
| Open | Pulimamdi Shyam Sunder Reddy | $428,560 | |
| Closed | Pulimamdi Shyam Sunder Reddy | $428,560 | |
| Previous Owner | Mazer Jeffrey D | $291,783 |
Source: Public Records
Tax History Compared to Growth
Tax History
| Year | Tax Paid | Tax Assessment Tax Assessment Total Assessment is a certain percentage of the fair market value that is determined by local assessors to be the total taxable value of land and additions on the property. | Land | Improvement |
|---|---|---|---|---|
| 2025 | $4,963 | $230,964 | $58,000 | $172,964 |
| 2024 | $4,963 | $207,768 | $48,000 | $159,768 |
| 2023 | $4,970 | $201,920 | $46,000 | $155,920 |
| 2022 | $4,608 | $135,080 | $24,000 | $111,080 |
| 2021 | $3,509 | $135,080 | $24,000 | $111,080 |
| 2020 | $3,342 | $127,008 | $16,800 | $110,208 |
| 2019 | $3,224 | $121,048 | $16,800 | $104,248 |
| 2018 | $3,129 | $116,328 | $12,400 | $103,928 |
| 2017 | $389 | $14,000 | $14,000 | $0 |
| 2016 | $377 | $16,000 | $16,000 | $0 |
| 2015 | $267 | $9,600 | $9,600 | $0 |
| 2014 | $254 | $9,600 | $0 | $0 |
Source: Public Records
Map
Nearby Homes
- 6215 Vista Crossing Way
- 6010 Vista Crossing Way
- 6370 Boulder Ridge
- Sexton Rd
- 6570 Canyon Cove
- 7260 Cox Rd
- 6660 Canyon Cove
- 0 Yarbrough Farm Trail Unit 7518033
- 0 Cox Rd Unit 10639616
- 0 Cox Rd Unit 25475533
- 4165 Milford Trail
- 3950 Grandview Manor Dr
- 3910 Pleasant Woods Dr
- 4450 Pleasant Woods Dr
- 5925 Crescent Landing Dr
- 6015 Thrasher Ct
- 6025 Crescent Landing Dr
- 4315 Sunflower Cir
- 4345 Sunflower Cir
- 7140 Hunters Trace Dr
- 6635 Bridge Stream Rd
- 6625 Bridge Stream Rd
- 6625 Bridge Stream Rd
- 6645 Bridge Stream Rd
- 6810 Grove Meadows Ln
- 6790 Grove Meadows Ln
- 6630 Bridge Stream Rd
- 6630 Bridge Stream Rd
- 6620 Bridge Stream Rd
- 6620 Bridge Stream Rd
- 6615 Bridge Stream Rd
- 6640 Bridge Stream Rd
- 6640 Bridge Stream Rd
- 6780 Grove Meadows Ln
- 6650 Bridge Stream Rd
- 6650 Bridge Stream Rd
- 6620 Flagstone Ct
- 6815 Grove Meadows Ln
- 6815 Grove Meadows Ln Unit 1009
- 6805 Grove Meadows Ln