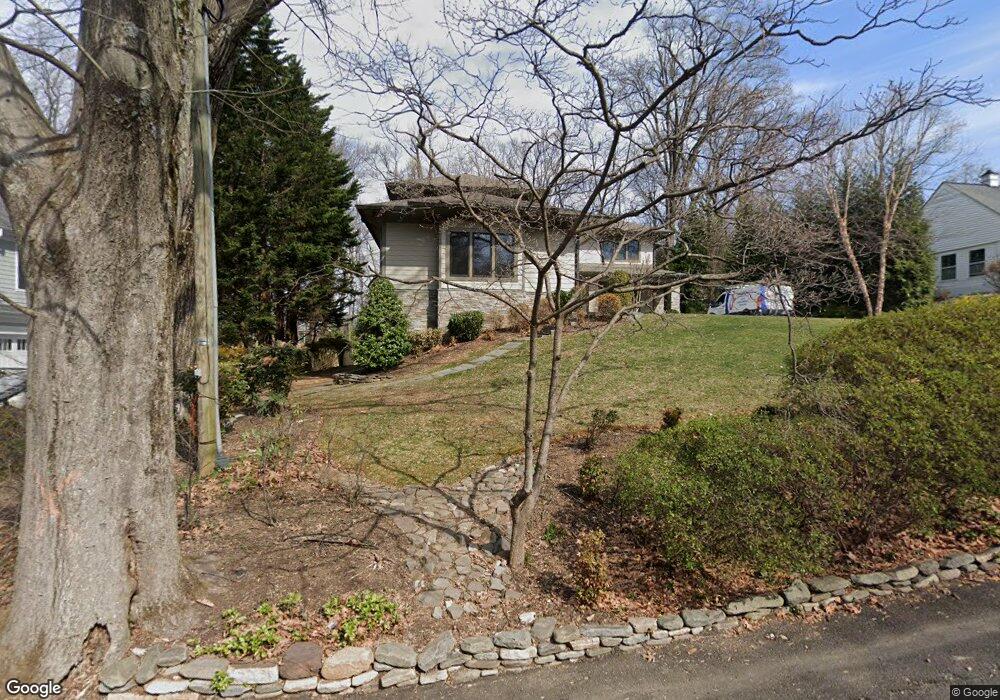
6636 Kirby Ct Falls Church, VA 22043
Estimated Value: $2,236,159 - $2,482,000
6
Beds
6
Baths
4,772
Sq Ft
$489/Sq Ft
Est. Value
About This Home
This home is located at 6636 Kirby Ct, Falls Church, VA 22043 and is currently estimated at $2,333,290, approximately $488 per square foot. 6636 Kirby Ct is a home located in Fairfax County with nearby schools including Haycock Elementary School, Longfellow Middle School, and Saint John the Beloved Academy.
Ownership History
Date
Name
Owned For
Owner Type
Purchase Details
Closed on
Feb 17, 2012
Sold by
Mcpherson Garnet D
Bought by
Wilson Gordon C
Current Estimated Value
Home Financials for this Owner
Home Financials are based on the most recent Mortgage that was taken out on this home.
Original Mortgage
$320,000
Outstanding Balance
$219,653
Interest Rate
3.93%
Mortgage Type
New Conventional
Estimated Equity
$2,113,637
Create a Home Valuation Report for This Property
The Home Valuation Report is an in-depth analysis detailing your home's value as well as a comparison with similar homes in the area
Home Values in the Area
Average Home Value in this Area
Purchase History
| Date | Buyer | Sale Price | Title Company |
|---|---|---|---|
| Wilson Gordon C | $663,000 | -- |
Source: Public Records
Mortgage History
| Date | Status | Borrower | Loan Amount |
|---|---|---|---|
| Open | Wilson Gordon C | $320,000 |
Source: Public Records
Tax History Compared to Growth
Tax History
| Year | Tax Paid | Tax Assessment Tax Assessment Total Assessment is a certain percentage of the fair market value that is determined by local assessors to be the total taxable value of land and additions on the property. | Land | Improvement |
|---|---|---|---|---|
| 2025 | $22,737 | $2,037,320 | $600,000 | $1,437,320 |
| 2024 | $22,737 | $1,877,420 | $495,000 | $1,382,420 |
| 2023 | $20,755 | $1,759,900 | $440,000 | $1,319,900 |
| 2022 | $19,823 | $1,658,640 | $440,000 | $1,218,640 |
| 2021 | $19,355 | $1,617,640 | $399,000 | $1,218,640 |
| 2020 | $19,420 | $1,609,640 | $391,000 | $1,218,640 |
| 2019 | $18,986 | $1,573,640 | $355,000 | $1,218,640 |
| 2018 | $18,097 | $1,573,640 | $355,000 | $1,218,640 |
| 2017 | $18,620 | $1,572,640 | $354,000 | $1,218,640 |
| 2016 | $18,875 | $1,597,510 | $354,000 | $1,243,510 |
| 2015 | $16,914 | $1,484,950 | $328,000 | $1,156,950 |
| 2014 | $5,001 | $440,000 | $290,000 | $150,000 |
Source: Public Records
Map
Nearby Homes
- 6616 Kirby Ct
- 6610 Quinten St
- 6609 Rockmont Ct
- 6607 Midhill Place
- 6545 Placid St
- 2005 Highboro Way
- 2125 Hilltop Place
- 6712 Moly Dr
- 2221 Orchid Dr
- 6616 Fisher Ave
- 1904 Lamson Place
- 6613 Fisher Ave
- 6975 Idylwood Rd
- 2202 Grayson Place
- 6449 Orland St
- 6511 Ivy Hill Dr
- 6601 Gordon Ave
- 6613 Chesterfield Ave
- 2118 Greenwich St
- 2115 Natahoa Ct
- 6632 Kirby Ct
- 6642 Kirby Ct
- 6628 Kirby Ct
- 6639 Kirby Ct
- 6641 Kirby Ct
- 6633 Kirby Ct
- 6644 Kirby Ct
- 6643 Kirby Ct
- 6629 Kirby Ct
- 2030 Westmoreland St
- 6624 Kirby Ct
- 6645 Kirby Ct
- 6625 Kirby Ct
- 6620 Kirby Ct
- 6621 Kirby Ct
- 2036 Westmoreland St
- 2048 Westmoreland St
- 2100 Westmoreland St
- 0 Stockwell Manor Dr
- 2045 Westmoreland St