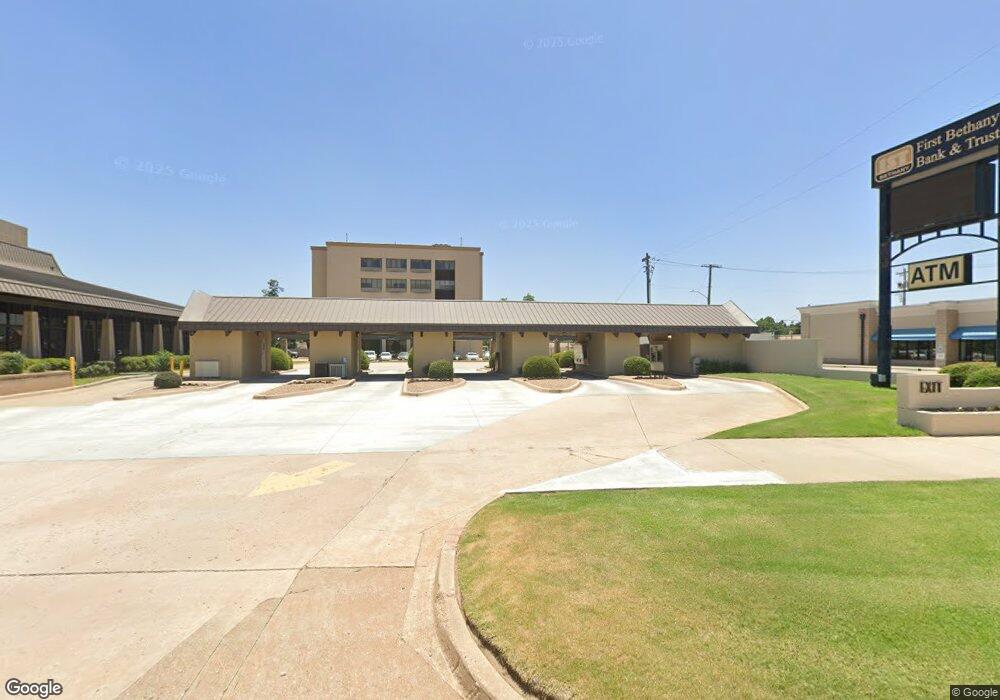
6636 NW 39th Expy Bethany, OK 73008
Estimated Value: $1,104,933
--
Bed
--
Bath
7,125
Sq Ft
$155/Sq Ft
Est. Value
About This Home
This home is located at 6636 NW 39th Expy, Bethany, OK 73008 and is currently estimated at $1,104,933, approximately $155 per square foot. 6636 NW 39th Expy is a home located in Oklahoma County with nearby schools including Earl Harris Elementary School, Bethany Middle School, and Bethany High School.
Ownership History
Date
Name
Owned For
Owner Type
Purchase Details
Closed on
Sep 2, 2021
Sold by
Mcguire Michael W and Mcguire Latricia
Bought by
Mcguire Holding Company Llc
Current Estimated Value
Home Financials for this Owner
Home Financials are based on the most recent Mortgage that was taken out on this home.
Original Mortgage
$985,200
Outstanding Balance
$896,459
Interest Rate
2.8%
Mortgage Type
Stand Alone First
Estimated Equity
$208,474
Purchase Details
Closed on
Oct 2, 2017
Sold by
Hardy James Windle and Ford Christopher C
Bought by
Mcguire Michael W
Purchase Details
Closed on
Apr 16, 1998
Sold by
Gillespie John G and Gillespie Celeste S
Bought by
Hardy James Windle and Ford Christopher C
Purchase Details
Closed on
Jun 20, 1997
Sold by
Gillespie John G and Gillespie Celeste S
Bought by
Gillespie John G and Gillespie Celeste S
Purchase Details
Closed on
Feb 13, 1997
Sold by
Gillespie John G and Gillespie Celeste
Bought by
Gillespie John G and Gillespie Celeste S
Create a Home Valuation Report for This Property
The Home Valuation Report is an in-depth analysis detailing your home's value as well as a comparison with similar homes in the area
Home Values in the Area
Average Home Value in this Area
Purchase History
| Date | Buyer | Sale Price | Title Company |
|---|---|---|---|
| Mcguire Holding Company Llc | -- | Oklahoma City Abstract & Ttl | |
| Mcguire Michael W | $700,000 | The Oklahoma City Abs & | |
| Hardy James Windle | -- | -- | |
| Gillespie John G | -- | -- | |
| Gillespie John G | -- | -- |
Source: Public Records
Mortgage History
| Date | Status | Borrower | Loan Amount |
|---|---|---|---|
| Open | Mcguire Holding Company Llc | $985,200 |
Source: Public Records
Tax History Compared to Growth
Tax History
| Year | Tax Paid | Tax Assessment Tax Assessment Total Assessment is a certain percentage of the fair market value that is determined by local assessors to be the total taxable value of land and additions on the property. | Land | Improvement |
|---|---|---|---|---|
| 2024 | $11,787 | $86,526 | $5,288 | $81,238 |
| 2023 | $11,787 | $86,526 | $5,288 | $81,238 |
| 2022 | $9,986 | $83,213 | $5,288 | $77,925 |
| 2021 | $9,733 | $81,354 | $5,170 | $76,184 |
| 2020 | $9,897 | $77,480 | $5,288 | $72,192 |
| 2019 | $9,424 | $77,480 | $5,288 | $72,192 |
| 2018 | $9,488 | $77,481 | $0 | $0 |
| 2017 | $3,753 | $30,038 | $2,895 | $27,143 |
| 2016 | $3,605 | $28,608 | $5,288 | $23,320 |
| 2015 | $3,417 | $28,608 | $5,288 | $23,320 |
| 2014 | $3,399 | $28,608 | $5,288 | $23,320 |
Source: Public Records
Map
Nearby Homes
- 3720 N Peniel Ave
- 3817 N Asbury Ave
- 6800 NW 36th St
- 6908 NW 36th St
- 4400 N Wheeler Ave
- 4507 N Donald Ave
- 4508 N College Ave
- 6618 NW 32nd St
- 4604 N Donald Ave
- 6802 NW 45th St
- 7014 NW 44th St
- 6019 NW 47th St
- 3707 Franks Way
- 5825 NW 34th St
- 6101 NW 48th St
- 4601 N Rockwell Ave
- 4908 N Central Rd
- 6112 NW 49th St
- 5712 NW 42nd St
- 7104 NW 32nd St
- 6636 NW 39th Expy Unit 108
- 6636 NW 39th Expy Unit 102
- 6636 NW 39th Expy Unit 110
- 6708 NW 39th Expy
- 6601 NW 38th St
- 3909 N Peniel Ave
- 6722 NW 39th Expy
- 3823 N College Ave
- 6726 NW 39th Expy
- 6728 NW 39th Expy
- 3817 N College Ave
- 3812 N College Ave
- 6734 NW 39th Expy
- 3820 N Peniel Ave
- 3903 N Donald Ave
- 3808 N College Ave
- 3901 N Donald Ave
- 3813 N Donald Ave
- 3807 N Peniel Ave
- 3809 N College Ave