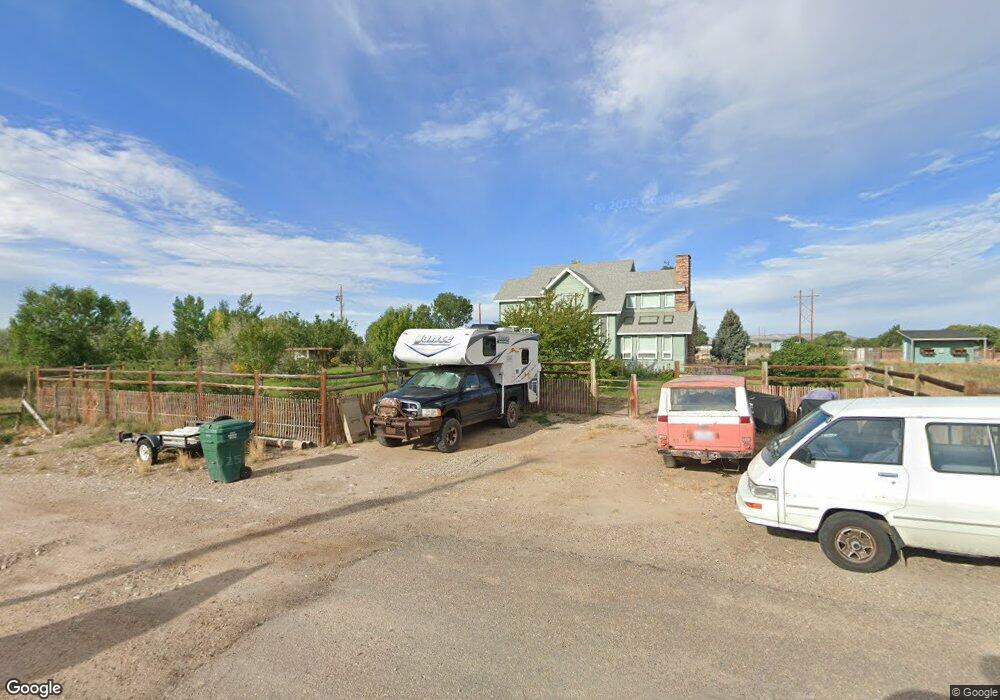
6638 S 9500 E Jensen, UT 84035
Estimated Value: $329,000 - $627,000
4
Beds
2
Baths
3,000
Sq Ft
$143/Sq Ft
Est. Value
About This Home
This home is located at 6638 S 9500 E, Jensen, UT 84035 and is currently estimated at $429,425, approximately $143 per square foot. 6638 S 9500 E is a home located in Uintah County with nearby schools including Davis School, Vernal Middle School, and Uintah Middle School.
Ownership History
Date
Name
Owned For
Owner Type
Purchase Details
Closed on
Jun 16, 2008
Sold by
Tullis Lesley and Shinkle Nathan
Bought by
Tullis Lesley J and Shinkle Nathan H
Current Estimated Value
Home Financials for this Owner
Home Financials are based on the most recent Mortgage that was taken out on this home.
Original Mortgage
$228,500
Outstanding Balance
$144,363
Interest Rate
5.75%
Mortgage Type
Construction
Estimated Equity
$285,062
Purchase Details
Closed on
Sep 29, 2006
Sold by
Brailsford Steven and Brailsford Jenny
Bought by
Bjerke Scott C and Bjerke Kristy
Home Financials for this Owner
Home Financials are based on the most recent Mortgage that was taken out on this home.
Original Mortgage
$170,551
Interest Rate
6.53%
Mortgage Type
Construction
Purchase Details
Closed on
Jul 31, 2006
Sold by
Shinkle Nathan and Tullis Lesley
Bought by
Tullis Lesley and Shinkley Nathan
Home Financials for this Owner
Home Financials are based on the most recent Mortgage that was taken out on this home.
Original Mortgage
$170,551
Interest Rate
6.53%
Mortgage Type
Construction
Purchase Details
Closed on
May 19, 2006
Sold by
Brailsford Steve and Brailsford Jenny
Bought by
Shinkle Nathan and Tullis Lesley
Create a Home Valuation Report for This Property
The Home Valuation Report is an in-depth analysis detailing your home's value as well as a comparison with similar homes in the area
Purchase History
| Date | Buyer | Sale Price | Title Company |
|---|---|---|---|
| Tullis Lesley J | -- | -- | |
| Bjerke Scott C | -- | -- | |
| Tullis Lesley | -- | -- | |
| Shinkle Nathan | -- | -- |
Source: Public Records
Mortgage History
| Date | Status | Borrower | Loan Amount |
|---|---|---|---|
| Open | Tullis Lesley J | $228,500 | |
| Closed | Bjerke Scott C | $170,551 | |
| Previous Owner | Tullis Lesley | $177,300 |
Source: Public Records
Tax History
| Year | Tax Paid | Tax Assessment Tax Assessment Total Assessment is a certain percentage of the fair market value that is determined by local assessors to be the total taxable value of land and additions on the property. | Land | Improvement |
|---|---|---|---|---|
| 2024 | $1,700 | $187,846 | $22,184 | $165,662 |
| 2023 | $1,673 | $164,996 | $22,184 | $142,812 |
| 2022 | $1,485 | $136,434 | $22,184 | $114,250 |
| 2021 | $1,545 | $117,392 | $22,184 | $95,208 |
| 2020 | $1,416 | $110,106 | $21,560 | $88,546 |
| 2019 | $1,426 | $110,106 | $21,560 | $88,546 |
| 2018 | $1,372 | $105,889 | $21,560 | $84,329 |
| 2017 | $13 | $105,889 | $21,560 | $84,329 |
| 2016 | $1,264 | $108,497 | $21,560 | $86,937 |
| 2015 | $1,215 | $113,073 | $21,560 | $91,513 |
| 2014 | $1,142 | $107,710 | $22,067 | $85,643 |
| 2013 | $1,166 | $107,710 | $22,067 | $85,643 |
Source: Public Records
Map
Nearby Homes
- 7600 E 6000 S
- 9235 S Redwash Hwy
- 6088 S 5500 E
- 5859 E Ashley Creek St
- 2098 Goose Ranch Rd
- 1972 Goose Ranch Rd
- 2042 Goose Ranch Rd
- 1804 Goose Ranch Rd
- 2148 Goose Ranch Rd
- 1902 Goose Ranch Rd
- 4111 E 4000 S
- 3955 4000 East St
- 3203 S 4000 E
- 3340 E 5000 S
- 3541 U S Highway 40
- 5065 S 3150 E
- 3331 E 3500 S Unit 4
- 3311 E 3500 S Unit 3
- 4977 S 2625 E
- 4726 S 2500 E
Your Personal Tour Guide
Ask me questions while you tour the home.