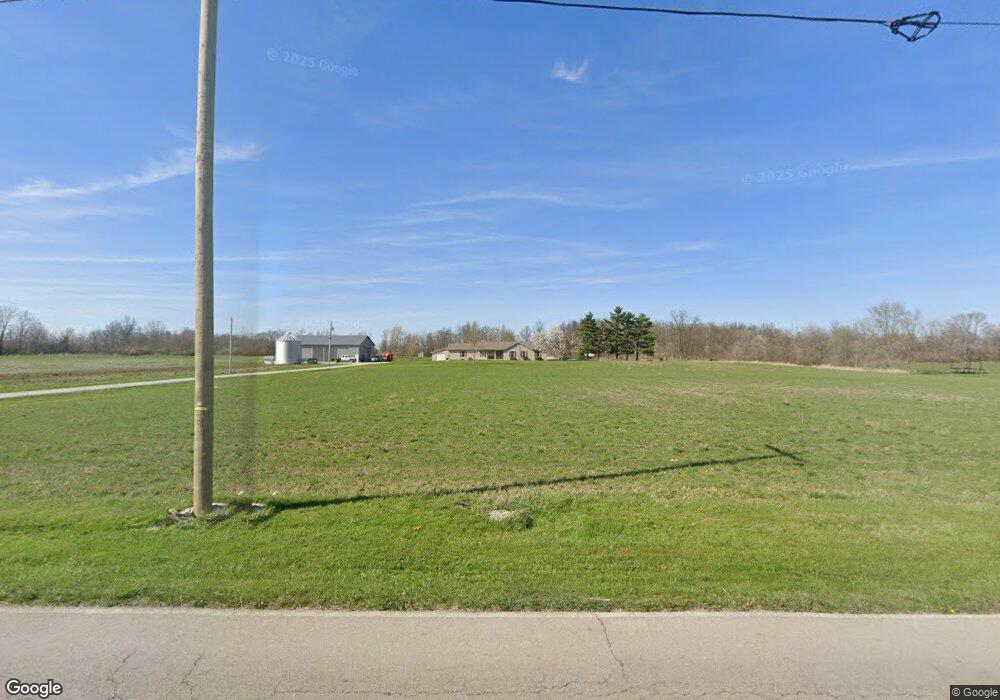
6639 E 400 N van Buren, IN 46991
Estimated Value: $224,000 - $431,000
3
Beds
2
Baths
1,782
Sq Ft
$197/Sq Ft
Est. Value
About This Home
This home is located at 6639 E 400 N, van Buren, IN 46991 and is currently estimated at $351,454, approximately $197 per square foot. 6639 E 400 N is a home located in Grant County with nearby schools including Eastbrook High School.
Ownership History
Date
Name
Owned For
Owner Type
Purchase Details
Closed on
Aug 21, 2018
Sold by
Korporal William A and Davis Karey A
Bought by
Korporal William A and Korporal Stephanie R
Current Estimated Value
Create a Home Valuation Report for This Property
The Home Valuation Report is an in-depth analysis detailing your home's value as well as a comparison with similar homes in the area
Home Values in the Area
Average Home Value in this Area
Purchase History
| Date | Buyer | Sale Price | Title Company |
|---|---|---|---|
| Korporal William A | -- | -- |
Source: Public Records
Tax History Compared to Growth
Tax History
| Year | Tax Paid | Tax Assessment Tax Assessment Total Assessment is a certain percentage of the fair market value that is determined by local assessors to be the total taxable value of land and additions on the property. | Land | Improvement |
|---|---|---|---|---|
| 2024 | $1,726 | $235,600 | $41,800 | $193,800 |
| 2023 | $2,053 | $233,600 | $38,700 | $194,900 |
| 2022 | $1,995 | $214,600 | $35,500 | $179,100 |
| 2021 | $1,754 | $190,600 | $33,800 | $156,800 |
| 2020 | $1,614 | $184,800 | $33,700 | $151,100 |
| 2019 | $1,600 | $189,600 | $36,000 | $153,600 |
| 2018 | $1,566 | $191,500 | $36,400 | $155,100 |
| 2017 | $1,319 | $177,800 | $38,300 | $139,500 |
| 2016 | $1,280 | $180,300 | $39,200 | $141,100 |
| 2014 | $1,143 | $169,400 | $39,900 | $129,500 |
| 2013 | $1,143 | $165,300 | $37,600 | $127,700 |
Source: Public Records
Map
Nearby Homes
- 4015 N 600 E
- 210 N Wayne St
- 2351 N 800 E
- 8885 E 400 N
- 111 W Penn St
- 503 E Main St
- 3781 E 350 N
- 6060 E 100 N
- I 69 E 700 N
- 3225 E 200 N
- 2142 N Bethlehem Rd
- 10622 S 600 W
- 2701 E Bradford Pike
- 5928 E Montpelier Pike
- 1641 E Martha Dr
- 9462 W 1200 S 35
- 10700 S 800 West - 35 Rd
- 933 E Bocock Rd
- 853 S 400 E
- 1700 E Bradford Pike