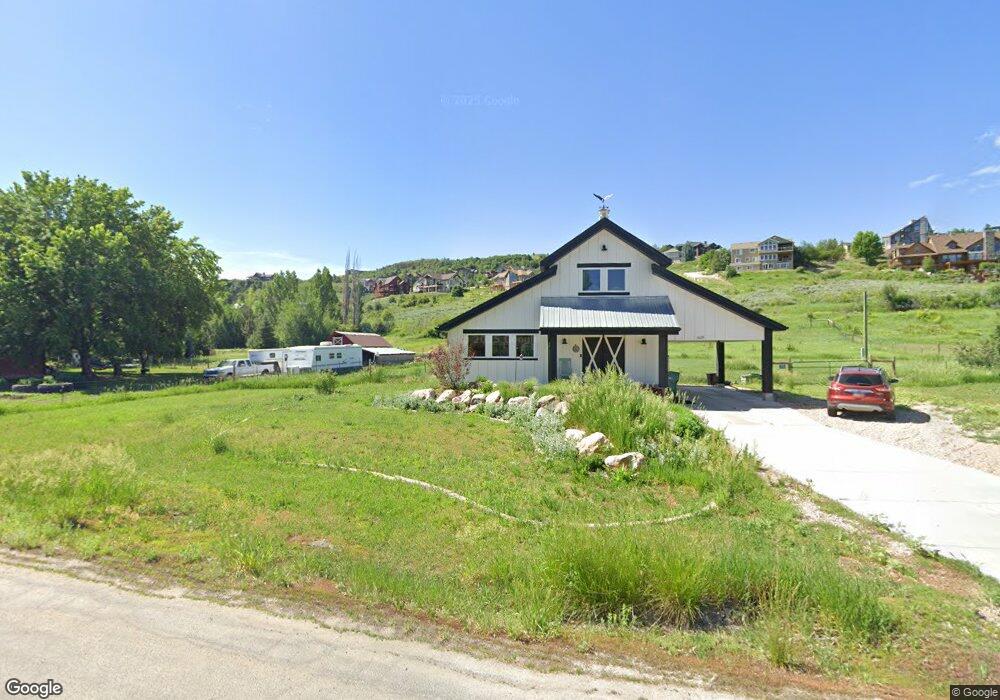
6639 E 950 S Unit 16 Huntsville, UT 84317
Estimated Value: $714,000 - $778,000
2
Beds
2
Baths
1,260
Sq Ft
$597/Sq Ft
Est. Value
About This Home
This home is located at 6639 E 950 S Unit 16, Huntsville, UT 84317 and is currently estimated at $751,894, approximately $596 per square foot. 6639 E 950 S Unit 16 is a home located in Weber County with nearby schools including Valley Elementary School, Snowcrest Junior High School, and Weber High School.
Ownership History
Date
Name
Owned For
Owner Type
Purchase Details
Closed on
Nov 5, 2025
Sold by
Neff Garrett and Neff Brittney
Bought by
Schuldt Rick and Kapalla-Schuldt Kim
Current Estimated Value
Purchase Details
Closed on
Aug 29, 2025
Sold by
Kramer Laura J
Bought by
Neff Garrett and Neff Brittney
Home Financials for this Owner
Home Financials are based on the most recent Mortgage that was taken out on this home.
Original Mortgage
$610,000
Interest Rate
6.74%
Mortgage Type
New Conventional
Purchase Details
Closed on
Oct 19, 2017
Sold by
Allen Berit
Bought by
Kramer Laura J
Home Financials for this Owner
Home Financials are based on the most recent Mortgage that was taken out on this home.
Original Mortgage
$238,095
Interest Rate
3.87%
Mortgage Type
FHA
Purchase Details
Closed on
Oct 3, 2014
Sold by
Vernieuw Wallace R and Vernieuw Renae Y
Bought by
Allen Berit
Create a Home Valuation Report for This Property
The Home Valuation Report is an in-depth analysis detailing your home's value as well as a comparison with similar homes in the area
Home Values in the Area
Average Home Value in this Area
Purchase History
| Date | Buyer | Sale Price | Title Company |
|---|---|---|---|
| Schuldt Rick | -- | Metro National Title | |
| Neff Garrett | -- | Metro National Title | |
| Kramer Laura J | -- | Stewart Title Ins Agency Of | |
| Allen Berit | -- | First American |
Source: Public Records
Mortgage History
| Date | Status | Borrower | Loan Amount |
|---|---|---|---|
| Previous Owner | Neff Garrett | $610,000 | |
| Previous Owner | Kramer Laura J | $238,095 |
Source: Public Records
Tax History Compared to Growth
Tax History
| Year | Tax Paid | Tax Assessment Tax Assessment Total Assessment is a certain percentage of the fair market value that is determined by local assessors to be the total taxable value of land and additions on the property. | Land | Improvement |
|---|---|---|---|---|
| 2025 | $3,075 | $574,968 | $279,023 | $295,945 |
| 2024 | $2,750 | $288,829 | $139,500 | $149,329 |
| 2023 | $2,542 | $263,404 | $111,243 | $152,161 |
| 2022 | $2,391 | $251,672 | $94,161 | $157,511 |
| 2021 | $1,851 | $327,882 | $136,013 | $191,869 |
| 2020 | $1,681 | $273,000 | $116,084 | $156,916 |
| 2019 | $1,572 | $244,000 | $116,084 | $127,916 |
| 2018 | $1,407 | $209,280 | $90,600 | $118,680 |
| 2017 | $1,331 | $194,986 | $90,600 | $104,386 |
| 2016 | $1,299 | $103,493 | $50,100 | $53,393 |
| 2015 | $1,003 | $80,610 | $80,610 | $0 |
| 2014 | $1,026 | $80,610 | $80,610 | $0 |
Source: Public Records
Map
Nearby Homes
- 6486 E Highway 39 Unit 47
- 6486 E Highway 39 Unit 64
- 6486 E Highway 39 Unit 32
- 6486 E Highway 39 Unit 24
- 1380 S Innsbruck Dr E Unit 39
- 6486 E Hwy 39 Unit 47
- 6486 E Hwy 39 Unit 64
- 1215 S Via Monaco Dr Unit 1
- 946 S Meadowlark Ln
- 1018 S Meadowlark Ln Unit 2
- 6462 Summit Cove
- 6839 E Summit Peak Cir Unit 48
- 6858 E Summit Peak Cir
- 6390 E Hawks Ln Unit 52
- 6339 E Quail Ln
- 6321 E Hawks Ln Unit 54
- 6339 E Hawks Ln Unit 59R
- 6260 E Hawks Ln
- 6188 E Hummingbird Point
- 6527 E Chapparal Unit 33
- 6640 E 950 S
- 6617 E 950 S
- 6617 E 950 S Unit 17
- 6660 E 950 S
- 6659 E 950 S
- 6616 E 950 S
- 6679 E 950 S
- 939 S 6600 E
- 6680 E 950 S
- 6702 E 950 S
- 6614 E 1100 S
- 6614 E 1100 S Unit 14
- 6699 E 950 S Unit 13
- 919 S 6600 E
- 6596 E 1100 S
- 6574 E 1100 S
- 6574 E 1100 S Unit 5
- 6640 E 1100 S
- 6640 E 1100 S Unit 15
- 6552 E 1100 S Unit 4