Estimated Value: $177,262 - $298,000
Studio
1
Bath
1,379
Sq Ft
$170/Sq Ft
Est. Value
About This Home
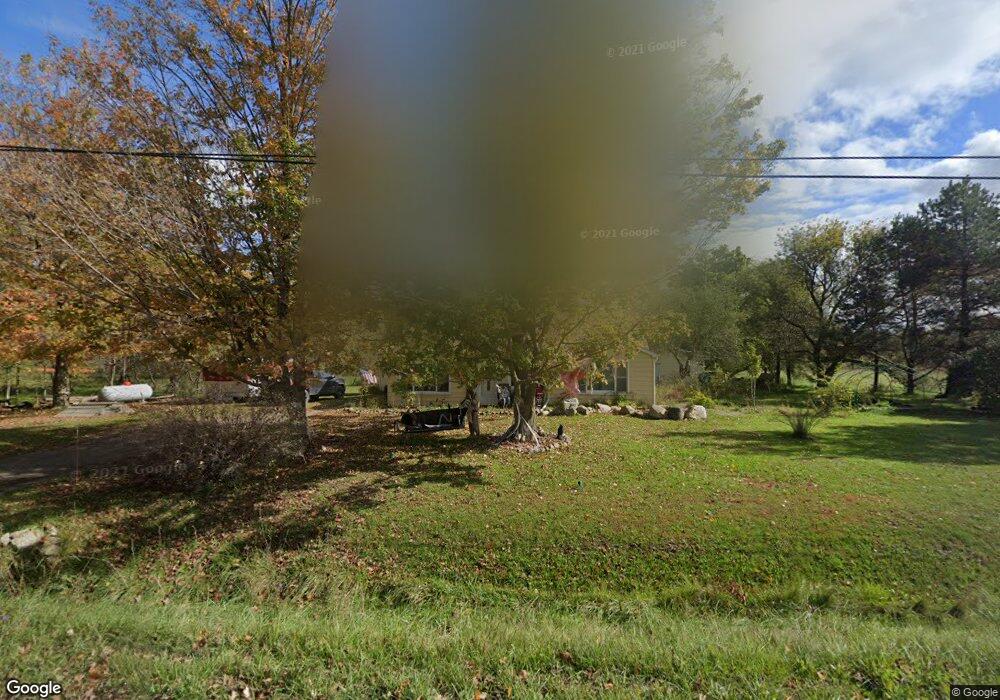
This home is located at 664 Braidwood Rd, Riley, MI 48041 and is currently estimated at $235,066, approximately $170 per square foot. 664 Braidwood Rd is a home located in St. Clair County with nearby schools including Memphis Elementary School and Memphis Junior/Senior High School.
Ownership History
Date
Name
Owned For
Owner Type
Purchase Details
Closed on
Jul 16, 2018
Sold by
Mayer and Jacqueline
Bought by
Dickerson-Janssens Bobby B
Current Estimated Value
Home Financials for this Owner
Home Financials are based on the most recent Mortgage that was taken out on this home.
Original Mortgage
$132,323
Outstanding Balance
$114,437
Interest Rate
4.5%
Mortgage Type
New Conventional
Estimated Equity
$120,629
Purchase Details
Closed on
Oct 26, 2017
Sold by
Moses Virginia L
Bought by
Mayer Mitchell and Mayer Jacqueline
Purchase Details
Closed on
Oct 12, 2017
Sold by
Moses Virginia L
Bought by
Moses Virginia L
Create a Home Valuation Report for This Property
The Home Valuation Report is an in-depth analysis detailing your home's value as well as a comparison with similar homes in the area
Home Values in the Area
Average Home Value in this Area
Purchase History
| Date | Buyer | Sale Price | Title Company |
|---|---|---|---|
| Dickerson-Janssens Bobby B | $131,000 | Ata National Title Group | |
| Mayer Mitchell | $50,000 | Liberty Title & Escrow | |
| Moses Virginia L | -- | -- |
Source: Public Records
Mortgage History
| Date | Status | Borrower | Loan Amount |
|---|---|---|---|
| Open | Dickerson-Janssens Bobby B | $132,323 |
Source: Public Records
Tax History
| Year | Tax Paid | Tax Assessment Tax Assessment Total Assessment is a certain percentage of the fair market value that is determined by local assessors to be the total taxable value of land and additions on the property. | Land | Improvement |
|---|---|---|---|---|
| 2025 | $1,184 | $85,600 | $0 | $0 |
| 2024 | $1,169 | $82,500 | $0 | $0 |
| 2023 | $1,113 | $73,100 | $0 | $0 |
| 2022 | $1,845 | $67,100 | $0 | $0 |
| 2020 | $1,722 | $58,200 | $58,200 | $0 |
| 2019 | $1,690 | $48,100 | $0 | $0 |
| 2018 | $2,323 | $47,700 | $0 | $0 |
| 2017 | $1,062 | $44,500 | $0 | $0 |
| 2016 | $381 | $44,500 | $0 | $0 |
| 2015 | -- | $43,500 | $43,500 | $0 |
| 2014 | -- | $35,900 | $35,900 | $0 |
| 2013 | -- | $33,200 | $0 | $0 |
Source: Public Records
Map
Nearby Homes
- 00 Belle River Lot Q Rd
- 00 Belle River Lot R
- 0 Burgess 040 Rd
- 30600 Bordman Rd
- 13199 Masters Rd Masters Rd
- 0 Masters Rd
- 34720 W Maple St
- 34746 Benton St
- 34461 Pratt Rd
- 0 Main St
- 79446 Deland Rd
- 51 Riley Center Rd
- 27780 Pratt Rd
- 11377 Hill Rd
- 1700 Kinney Rd
- 12274 Griffin Rd
- 00 Angling Rd #6 Rd
- 32011 School Section Rd
- 12337 Dunn Rd
- 575 Stoddard Rd
- 644 Braidwood Rd
- 669 Braidwood Rd
- 632 Braidwood Rd
- 632 Braidwood Rd
- 11917 Gilbert Rd
- 11997 Gilbert Rd
- 629 Braidwood Rd
- 612 Braidwood Rd
- 611 Braidwood Rd Unit Bldg-Unit
- 611 Braidwood Rd
- 12070 Belle River Rd
- 12042 Belle River Rd
- 12062 Belle River Rd
- 11958 Gilbert Rd
- 12080 Belle River Rd
- 11875 Gilbert Rd
- 12012 Belle River Rd
- 770 Braidwood Rd
- 11920 Gilbert Rd
- 12086 Belle River Rd
Your Personal Tour Guide
Ask me questions while you tour the home.