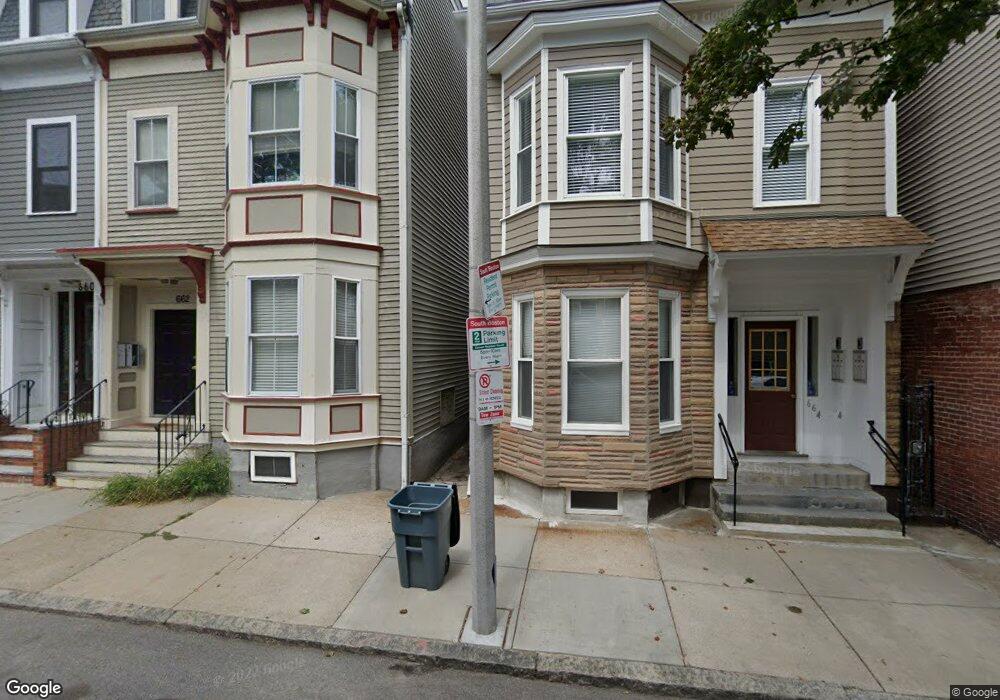
664 E 7th St Boston, MA 02127
South Boston NeighborhoodEstimated Value: $1,466,000 - $1,658,000
4
Beds
3
Baths
2,522
Sq Ft
$617/Sq Ft
Est. Value
About This Home
This home is located at 664 E 7th St, Boston, MA 02127 and is currently estimated at $1,555,667, approximately $616 per square foot. 664 E 7th St is a home located in Suffolk County with nearby schools including South Boston Catholic Academy, Gate of Heaven Elementary School, and St Peter Academy.
Ownership History
Date
Name
Owned For
Owner Type
Purchase Details
Closed on
May 16, 2025
Sold by
Hynes John P
Bought by
Hynes John P and Mcdonough-Hynes Alice M
Current Estimated Value
Purchase Details
Closed on
Apr 4, 1988
Sold by
Dinsmoor Kathy M
Bought by
Hynes John P
Home Financials for this Owner
Home Financials are based on the most recent Mortgage that was taken out on this home.
Original Mortgage
$100,000
Interest Rate
9.89%
Create a Home Valuation Report for This Property
The Home Valuation Report is an in-depth analysis detailing your home's value as well as a comparison with similar homes in the area
Home Values in the Area
Average Home Value in this Area
Purchase History
| Date | Buyer | Sale Price | Title Company |
|---|---|---|---|
| Hynes John P | -- | None Available | |
| Hynes John P | -- | None Available | |
| Hynes John P | $57,563 | -- |
Source: Public Records
Mortgage History
| Date | Status | Borrower | Loan Amount |
|---|---|---|---|
| Previous Owner | Hynes John P | $100,000 | |
| Previous Owner | Hynes John P | $100,000 |
Source: Public Records
Tax History
| Year | Tax Paid | Tax Assessment Tax Assessment Total Assessment is a certain percentage of the fair market value that is determined by local assessors to be the total taxable value of land and additions on the property. | Land | Improvement |
|---|---|---|---|---|
| 2025 | $11,653 | $1,006,300 | $411,800 | $594,500 |
| 2024 | $13,427 | $1,231,800 | $281,600 | $950,200 |
| 2023 | $12,481 | $1,162,100 | $265,700 | $896,400 |
| 2022 | $11,494 | $1,056,400 | $241,500 | $814,900 |
| 2021 | $11,272 | $1,056,400 | $241,500 | $814,900 |
| 2020 | $9,953 | $942,500 | $216,600 | $725,900 |
| 2019 | $9,464 | $897,900 | $162,700 | $735,200 |
| 2018 | $8,483 | $809,400 | $162,700 | $646,700 |
| 2017 | $8,161 | $770,600 | $162,700 | $607,900 |
| 2016 | $7,370 | $670,000 | $162,700 | $507,300 |
| 2015 | $7,261 | $599,600 | $176,500 | $423,100 |
| 2014 | $6,415 | $509,900 | $176,500 | $333,400 |
Source: Public Records
Map
Nearby Homes
- 645 E 6th St
- 691 E 8th St Unit 1
- 613 E 6th St Unit 3
- 655 E 5th St
- 309-311 Emerson St Unit 8
- 309 Emerson St Unit 14
- 722 E 6th St
- 703 E 5th St Unit 1
- 137 N St Unit 3
- 317 K St
- 297 K St Unit 1
- 297 K St Unit 2
- 404R K St (Spot 4)
- 400-R K Unit 17
- 400-R K Unit 15
- 729-731 E 5th St
- 722 E 5th St Unit TH
- 714 E 4th St Unit 3
- 564 E 5th St
- 581 E 8th St Unit 1
- 662 E 7th St Unit 3
- 662 E 7th St Unit 2
- 662 E 7th St Unit 1
- 159 M St Unit 165-1
- 159 M St Unit 2
- 159 M St Unit 1
- 165 M St Unit 3
- 165 M St Unit 2
- 165 M St Unit 1
- 165 M St Unit 3, 165
- 157 M St
- 157 M St Unit 3
- 157 M St Unit 1
- 157 M St Unit 2
- 660 E 7th St
- 660 E 7th St Unit 1
- 660 E 7th St Unit 2
- 155 M St
- 153 M St
- 658 E 7th St
Your Personal Tour Guide
Ask me questions while you tour the home.