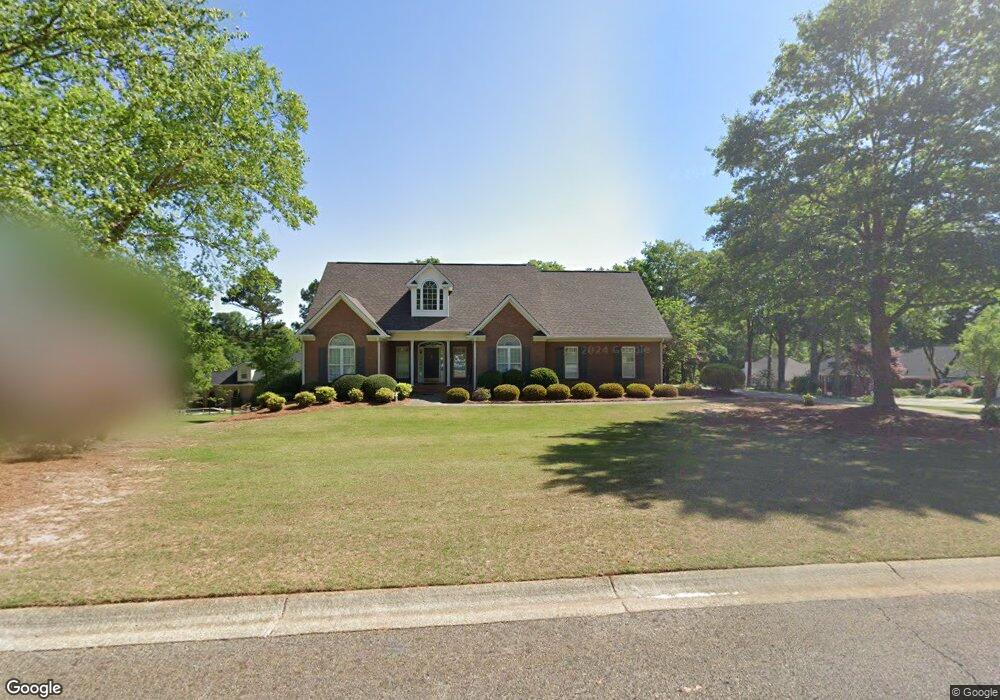
664 Iris Ln Winder, GA 30680
Estimated Value: $400,342 - $550,000
Studio
3
Baths
2,626
Sq Ft
$188/Sq Ft
Est. Value
About This Home
This home is located at 664 Iris Ln, Winder, GA 30680 and is currently estimated at $492,586, approximately $187 per square foot. 664 Iris Ln is a home located in Barrow County with nearby schools including Holsenbeck Elementary School, Bear Creek Middle School, and Winder-Barrow High School.
Ownership History
Date
Name
Owned For
Owner Type
Purchase Details
Closed on
Apr 16, 2021
Sold by
Casper Cynthia Kemp
Bought by
Melton Laura Q and Melton Jarred H
Current Estimated Value
Home Financials for this Owner
Home Financials are based on the most recent Mortgage that was taken out on this home.
Original Mortgage
$190,000
Outstanding Balance
$139,749
Interest Rate
3%
Mortgage Type
New Conventional
Estimated Equity
$352,837
Purchase Details
Closed on
Dec 29, 2020
Sold by
Kemp W H
Bought by
Casper Cynthia Kemp
Create a Home Valuation Report for This Property
The Home Valuation Report is an in-depth analysis detailing your home's value as well as a comparison with similar homes in the area
Home Values in the Area
Average Home Value in this Area
Purchase History
| Date | Buyer | Sale Price | Title Company |
|---|---|---|---|
| Melton Laura Q | $200,000 | -- | |
| Casper Cynthia Kemp | -- | -- |
Source: Public Records
Mortgage History
| Date | Status | Borrower | Loan Amount |
|---|---|---|---|
| Open | Melton Laura Q | $190,000 |
Source: Public Records
Tax History
| Year | Tax Paid | Tax Assessment Tax Assessment Total Assessment is a certain percentage of the fair market value that is determined by local assessors to be the total taxable value of land and additions on the property. | Land | Improvement |
|---|---|---|---|---|
| 2025 | $5,370 | $194,724 | $38,000 | $156,724 |
| 2024 | $5,349 | $190,542 | $38,000 | $152,542 |
| 2023 | $5,332 | $190,542 | $38,000 | $152,542 |
| 2022 | $4,889 | $146,195 | $28,800 | $117,395 |
| 2021 | $4,382 | $122,740 | $24,000 | $98,740 |
| 2020 | $2,176 | $118,076 | $24,000 | $94,076 |
| 2019 | $2,223 | $118,076 | $24,000 | $94,076 |
| 2018 | $2,106 | $114,076 | $20,000 | $94,076 |
| 2017 | $3,366 | $112,830 | $20,000 | $92,830 |
| 2016 | $1,785 | $104,281 | $24,000 | $80,281 |
| 2015 | $1,804 | $105,198 | $24,000 | $81,198 |
| 2014 | $1,324 | $91,882 | $9,800 | $82,082 |
| 2013 | -- | $85,781 | $9,800 | $75,981 |
Source: Public Records
Map
Nearby Homes
Your Personal Tour Guide
Ask me questions while you tour the home.