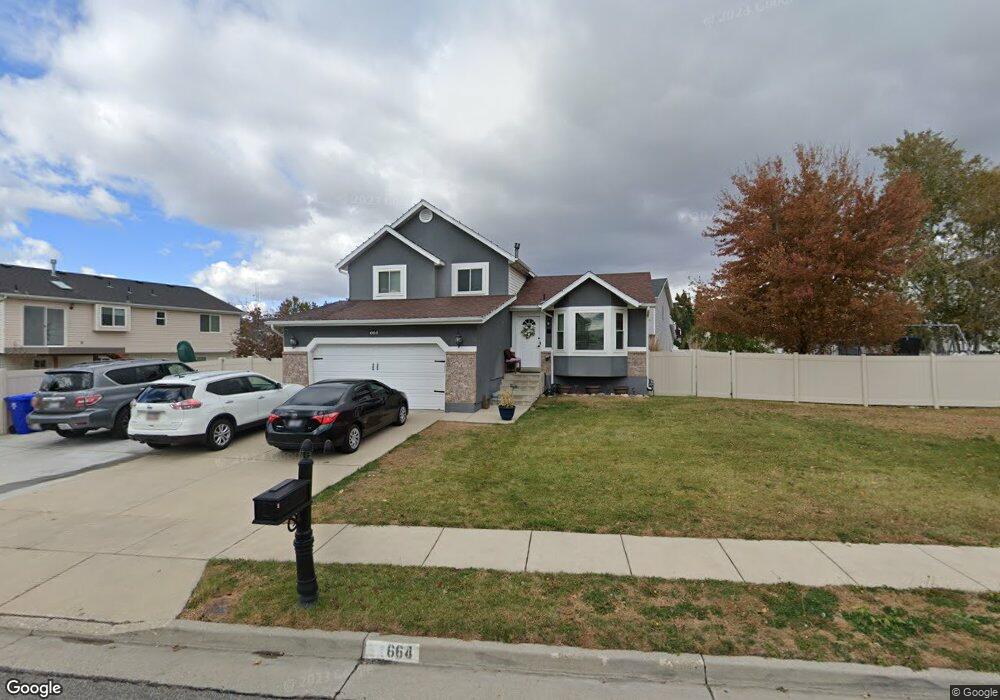
664 Jim Bridger Dr Centerville, UT 84014
Estimated Value: $552,785 - $586,000
4
Beds
4
Baths
1,917
Sq Ft
$296/Sq Ft
Est. Value
About This Home
This home is located at 664 Jim Bridger Dr, Centerville, UT 84014 and is currently estimated at $566,946, approximately $295 per square foot. 664 Jim Bridger Dr is a home located in Davis County with nearby schools including Stewart Elementary School, Centerville Jr High, and Viewmont High School.
Ownership History
Date
Name
Owned For
Owner Type
Purchase Details
Closed on
Mar 31, 2008
Sold by
Fielding Richard and Fielding Deborah
Bought by
Hatch Dayna H
Current Estimated Value
Purchase Details
Closed on
Jun 9, 2005
Sold by
Lund John F and Lund Lisa O
Bought by
Fielding Richard and Fielding Deborah
Home Financials for this Owner
Home Financials are based on the most recent Mortgage that was taken out on this home.
Original Mortgage
$153,600
Interest Rate
5.72%
Mortgage Type
Fannie Mae Freddie Mac
Purchase Details
Closed on
Jul 21, 1999
Sold by
Krisher Scott E and Krisher Deedee R
Bought by
Lund John F and Lund Lisa O
Home Financials for this Owner
Home Financials are based on the most recent Mortgage that was taken out on this home.
Original Mortgage
$160,600
Interest Rate
7.51%
Create a Home Valuation Report for This Property
The Home Valuation Report is an in-depth analysis detailing your home's value as well as a comparison with similar homes in the area
Purchase History
We collect this data history from publicly available records. To have your information removed, we recommend requesting removal directly through your county’s website.
| Date | Buyer | Sale Price | Title Company |
|---|---|---|---|
| Hatch Dayna H | -- | First American Title Ncs | |
| Fielding Richard | -- | Equity Title Ins Agency Inc | |
| Lund John F | -- | Associated Title Company |
Source: Public Records
Mortgage History
We collect this data history from publicly available records. To have your information removed, we recommend requesting removal directly through your county’s website.
| Date | Status | Borrower | Loan Amount |
|---|---|---|---|
| Previous Owner | Fielding Richard | $153,600 | |
| Previous Owner | Lund John F | $160,600 |
Source: Public Records
Tax History
| Year | Tax Paid | Tax Assessment Tax Assessment Total Assessment is a certain percentage of the fair market value that is determined by local assessors to be the total taxable value of land and additions on the property. | Land | Improvement |
|---|---|---|---|---|
| 2025 | $3,188 | $270,050 | $160,148 | $109,902 |
| 2024 | $2,879 | $260,700 | $143,190 | $117,510 |
| 2023 | $2,912 | $449,000 | $235,868 | $213,132 |
| 2022 | $3,106 | $260,150 | $118,898 | $141,252 |
| 2021 | $2,527 | $358,000 | $180,289 | $177,711 |
| 2020 | $2,259 | $319,000 | $176,716 | $142,284 |
| 2019 | $2,345 | $314,000 | $179,271 | $134,729 |
| 2018 | $2,117 | $292,000 | $166,466 | $125,534 |
| 2016 | $1,892 | $142,175 | $52,715 | $89,460 |
| 2015 | $1,777 | $130,405 | $52,715 | $77,690 |
| 2014 | $56 | $134,550 | $52,715 | $81,835 |
| 2013 | -- | $121,099 | $47,025 | $74,074 |
Source: Public Records
Map
Nearby Homes
- 592 Jim Bridger Dr
- 626 Jim Bridger Dr
- 1645 Pony Express Way
- 582 Jim Bridger Dr
- 1653 Pony Express Way
- 1635 Pony Express Way
- 643 Kit Carson Cir
- 607 Jim Bridger Dr
- 1659 Pony Express Way
- 587 Jim Bridger Dr
- 634 Kit Carson Cir
- 639 Jim Bridger Dr
- 639 Jim Bridger Dr Unit 1650
- 602 W 1650 N
- 664 W Jim Bridger Dr
- 577 Jim Bridger Dr
- 669 Kit Carson Cir
- 1665 Pony Express Way
- 555 W 1650 N
- 673 Jim Bridger Dr
Your Personal Tour Guide
Ask me questions while you tour the home.