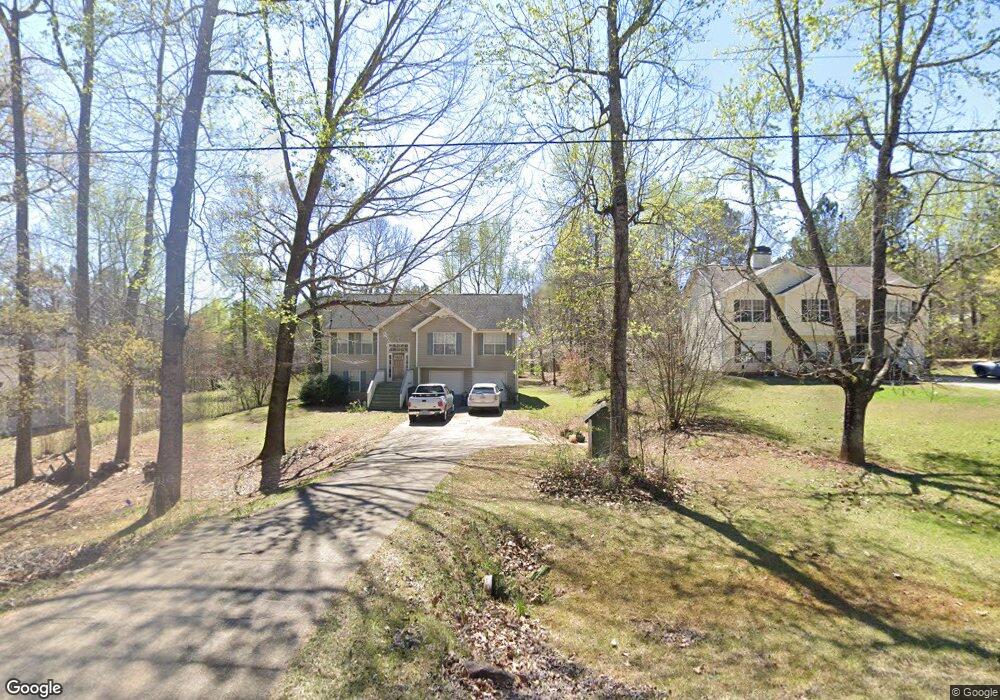
664 Leonard Rd Lagrange, GA 30241
Estimated Value: $216,000 - $258,000
3
Beds
2
Baths
1,222
Sq Ft
$192/Sq Ft
Est. Value
About This Home
This home is located at 664 Leonard Rd, Lagrange, GA 30241 and is currently estimated at $234,476, approximately $191 per square foot. 664 Leonard Rd is a home located in Troup County with nearby schools including Callaway Elementary School, Hogansville Elementary School, and Callaway Middle School.
Ownership History
Date
Name
Owned For
Owner Type
Purchase Details
Closed on
Jun 16, 2014
Sold by
Heard John R
Bought by
Heard John R
Current Estimated Value
Home Financials for this Owner
Home Financials are based on the most recent Mortgage that was taken out on this home.
Original Mortgage
$91,550
Outstanding Balance
$69,101
Interest Rate
4.23%
Mortgage Type
New Conventional
Estimated Equity
$165,375
Purchase Details
Closed on
Oct 3, 2003
Sold by
Branch Banking & Trust
Bought by
Heard John R and Heard Tabatha J
Purchase Details
Closed on
Apr 1, 2003
Sold by
Eric Morgan Pitman
Bought by
Branch Banking & Trust
Purchase Details
Closed on
Aug 28, 1999
Sold by
H & M Lenders Inc
Bought by
Eric Morgan Pitman
Purchase Details
Closed on
Aug 27, 1999
Sold by
Rustica Estates Inc
Bought by
H & M Lenders Inc
Purchase Details
Closed on
Sep 15, 1998
Sold by
Rustica Est Inc
Bought by
Rustica Estates Inc
Create a Home Valuation Report for This Property
The Home Valuation Report is an in-depth analysis detailing your home's value as well as a comparison with similar homes in the area
Home Values in the Area
Average Home Value in this Area
Purchase History
| Date | Buyer | Sale Price | Title Company |
|---|---|---|---|
| Heard John R | -- | -- | |
| Heard John R | $87,000 | -- | |
| Branch Banking & Trust | $80,000 | -- | |
| Eric Morgan Pitman | $99,900 | -- | |
| H & M Lenders Inc | -- | -- | |
| Rustica Estates Inc | -- | -- |
Source: Public Records
Mortgage History
| Date | Status | Borrower | Loan Amount |
|---|---|---|---|
| Open | Heard John R | $91,550 |
Source: Public Records
Tax History
| Year | Tax Paid | Tax Assessment Tax Assessment Total Assessment is a certain percentage of the fair market value that is determined by local assessors to be the total taxable value of land and additions on the property. | Land | Improvement |
|---|---|---|---|---|
| 2025 | $2,290 | $89,480 | $10,000 | $79,480 |
| 2024 | $2,116 | $79,560 | $10,000 | $69,560 |
| 2023 | $1,842 | $69,520 | $10,000 | $59,520 |
| 2022 | $1,688 | $62,480 | $5,000 | $57,480 |
| 2021 | $1,320 | $45,760 | $4,240 | $41,520 |
| 2020 | $1,113 | $45,760 | $4,240 | $41,520 |
| 2019 | $1,210 | $42,120 | $4,000 | $38,120 |
| 2018 | $1,160 | $40,440 | $4,000 | $36,440 |
| 2017 | $1,160 | $40,440 | $4,000 | $36,440 |
| 2016 | $1,131 | $39,492 | $4,000 | $35,492 |
| 2015 | $1,133 | $39,492 | $4,000 | $35,492 |
| 2014 | $1,079 | $37,624 | $4,000 | $33,624 |
| 2013 | -- | $38,803 | $4,000 | $34,803 |
Source: Public Records
Map
Nearby Homes
- 250 Mobley Bridge Rd
- 106 Jandale Dr
- 3315 Hammett Rd
- 119 Cedar Ridge Dr
- 102 Canterbury Dr
- 104 Canterbury Dr
- 100 Canterbury Dr
- 101 Sheffield Dr
- 3647 Youngs Mill Rd
- SMOKEMONT Smokemont Dr
- 207 N View Pointe Dr
- 789 Hammett Rd
- 10 Whitfield Rd
- 801 Marwari Way Unit 61
- 113 Wellington Dr
- 125 Hazel Way
- 24 N Brooks Rd
- 91 Richmond Dr
- 300 Old Pond Rd
- 0 Hines Rd Unit TRACT A
- 654 Leonard Rd
- 674 Leonard Rd
- 684 Leonard Rd
- 634 Leonard Rd
- 694 Leonard Rd
- 667 Leonard Rd
- 624 Leonard Rd
- 681 Leonard Rd
- 704 Leonard Rd
- 614 Leonard Rd
- 641 Leonard Rd
- 714 Leonard Rd
- 604 Leonard Rd
- 724 Leonard Rd
- 609 Leonard Rd
- 594 Leonard Rd
- 102 Pineland Ct
- 103 Pineland Ct
- 584 Leonard Rd
- 576 Leonard Rd
Your Personal Tour Guide
Ask me questions while you tour the home.