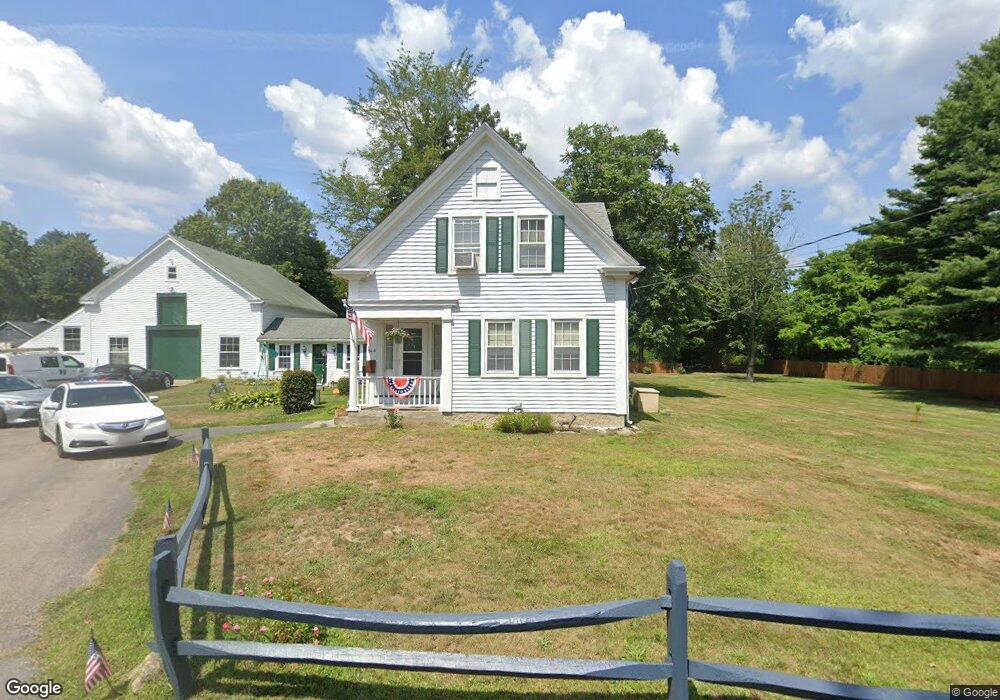
664 N Cary St Brockton, MA 02302
Montello NeighborhoodEstimated Value: $464,000 - $553,063
4
Beds
1
Bath
1,300
Sq Ft
$400/Sq Ft
Est. Value
About This Home
This home is located at 664 N Cary St, Brockton, MA 02302 and is currently estimated at $520,266, approximately $400 per square foot. 664 N Cary St is a home located in Plymouth County with nearby schools including Brookfield Elementary School, Mary E. Baker Elementary School, and Downey Elementary School.
Ownership History
Date
Name
Owned For
Owner Type
Purchase Details
Closed on
Sep 20, 2021
Sold by
Vankatherine
Bought by
Vanjohn Farren and Cook Kellie
Current Estimated Value
Home Financials for this Owner
Home Financials are based on the most recent Mortgage that was taken out on this home.
Original Mortgage
$200,000
Outstanding Balance
$181,985
Interest Rate
2.8%
Mortgage Type
Stand Alone Refi Refinance Of Original Loan
Estimated Equity
$338,281
Create a Home Valuation Report for This Property
The Home Valuation Report is an in-depth analysis detailing your home's value as well as a comparison with similar homes in the area
Home Values in the Area
Average Home Value in this Area
Purchase History
| Date | Buyer | Sale Price | Title Company |
|---|---|---|---|
| Vanjohn Farren | -- | None Available | |
| Vanjohn Farren | -- | None Available |
Source: Public Records
Mortgage History
| Date | Status | Borrower | Loan Amount |
|---|---|---|---|
| Open | Vanjohn Farren | $200,000 |
Source: Public Records
Tax History Compared to Growth
Tax History
| Year | Tax Paid | Tax Assessment Tax Assessment Total Assessment is a certain percentage of the fair market value that is determined by local assessors to be the total taxable value of land and additions on the property. | Land | Improvement |
|---|---|---|---|---|
| 2025 | $5,768 | $476,300 | $222,800 | $253,500 |
| 2024 | $5,600 | $465,900 | $222,800 | $243,100 |
| 2023 | $5,685 | $438,000 | $193,000 | $245,000 |
| 2022 | $5,508 | $394,300 | $177,800 | $216,500 |
| 2021 | $4,821 | $332,500 | $144,300 | $188,200 |
| 2020 | $4,836 | $319,200 | $138,200 | $181,000 |
| 2019 | $4,497 | $289,400 | $125,400 | $164,000 |
| 2018 | $4,394 | $277,100 | $125,400 | $151,700 |
| 2017 | $4,394 | $272,900 | $125,400 | $147,500 |
| 2016 | $4,107 | $236,600 | $124,000 | $112,600 |
| 2015 | $3,726 | $205,300 | $124,000 | $81,300 |
| 2014 | $3,845 | $212,100 | $124,000 | $88,100 |
Source: Public Records
Map
Nearby Homes
- 18 Dixon Rd
- 89 Dixon Rd
- 176 Coe Rd
- 22 Blossom St
- 21 Maplewood Cir
- 187 Arthur St
- 307 Regency Ln Unit 307
- 53 Kent St
- 101 Regency Ln
- 61 Kent St
- 97 Waleco Rd
- 22 Hartley Ave
- 298 N Quincy St
- 59 Merton St
- 717 Hampton Way
- 95 Nicholson Dr
- 285 Hovendon Ave
- 79 Nicholson Dr
- 200 Sawtell Ave
- 305 Rembrandt Way Unit 305