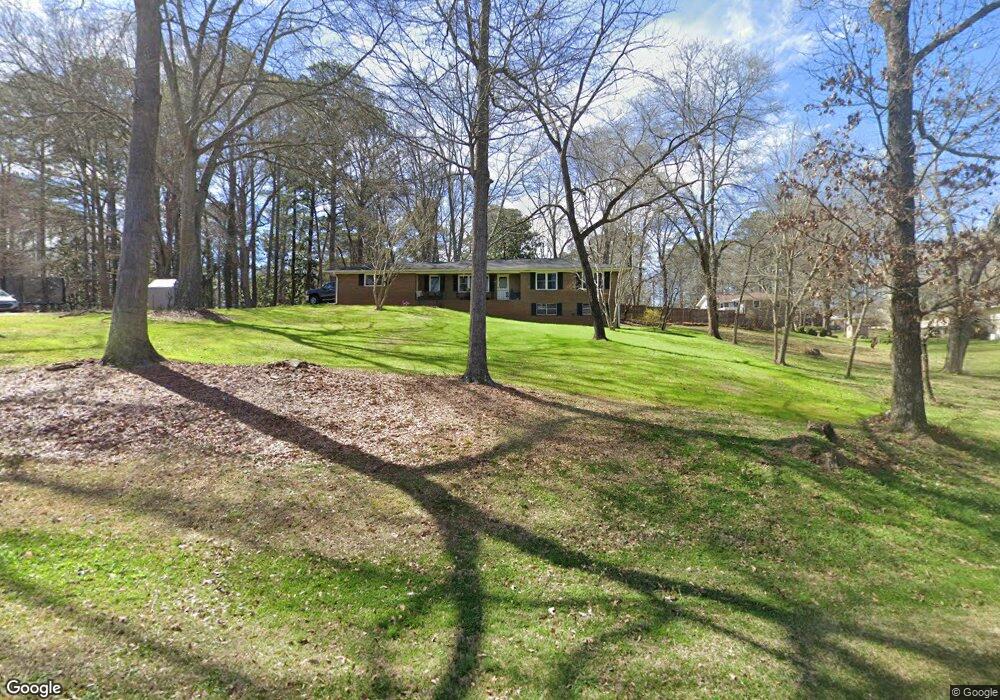
664 N Spring St Tallapoosa, GA 30176
Estimated Value: $175,000 - $240,000
3
Beds
2
Baths
1,454
Sq Ft
$150/Sq Ft
Est. Value
About This Home
This home is located at 664 N Spring St, Tallapoosa, GA 30176 and is currently estimated at $217,947, approximately $149 per square foot. 664 N Spring St is a home located in Haralson County with nearby schools including Haralson County High School.
Ownership History
Date
Name
Owned For
Owner Type
Purchase Details
Closed on
Apr 2, 2010
Sold by
Secretary Of Housing
Bought by
Thompson Thomas W
Current Estimated Value
Home Financials for this Owner
Home Financials are based on the most recent Mortgage that was taken out on this home.
Original Mortgage
$62,848
Outstanding Balance
$42,374
Interest Rate
5.25%
Mortgage Type
FHA
Estimated Equity
$175,573
Purchase Details
Closed on
Jun 2, 2009
Sold by
Suntrust Mortgage Inc
Bought by
Secretary Of Housing & Urban Development
Purchase Details
Closed on
Apr 28, 2006
Sold by
Gable Beverly Sue
Bought by
Key Mary Emily
Purchase Details
Closed on
Apr 26, 2006
Sold by
Not Provided
Bought by
Thompson Thomas W
Purchase Details
Closed on
Jun 3, 2004
Sold by
Key Harrison S Sr & Sarah Helen Life Est
Bought by
Gable Beverly Sue % and Key Alan Scot
Create a Home Valuation Report for This Property
The Home Valuation Report is an in-depth analysis detailing your home's value as well as a comparison with similar homes in the area
Home Values in the Area
Average Home Value in this Area
Purchase History
| Date | Buyer | Sale Price | Title Company |
|---|---|---|---|
| Thompson Thomas W | $61,900 | -- | |
| Secretary Of Housing & Urban Development | -- | -- | |
| Key Mary Emily | $105,669 | -- | |
| Thompson Thomas W | -- | -- | |
| Gable Beverly Sue % | -- | -- |
Source: Public Records
Mortgage History
| Date | Status | Borrower | Loan Amount |
|---|---|---|---|
| Open | Thompson Thomas W | $62,848 |
Source: Public Records
Tax History Compared to Growth
Tax History
| Year | Tax Paid | Tax Assessment Tax Assessment Total Assessment is a certain percentage of the fair market value that is determined by local assessors to be the total taxable value of land and additions on the property. | Land | Improvement |
|---|---|---|---|---|
| 2024 | $1,590 | $52,058 | $4,834 | $47,224 |
| 2023 | $1,763 | $55,462 | $4,560 | $50,902 |
| 2022 | $1,141 | $44,194 | $4,560 | $39,634 |
| 2021 | $1,101 | $40,834 | $4,560 | $36,274 |
| 2020 | $1,143 | $42,256 | $4,560 | $37,696 |
| 2019 | $1,154 | $41,134 | $4,560 | $36,574 |
| 2018 | $1,168 | $41,134 | $4,560 | $36,574 |
| 2017 | $1,139 | $36,595 | $4,560 | $32,035 |
| 2016 | $1,053 | $36,119 | $4,560 | $31,559 |
| 2015 | $1,049 | $35,796 | $4,560 | $31,236 |
| 2014 | $1,172 | $38,836 | $7,600 | $31,236 |
Source: Public Records
Map
Nearby Homes
- 164 Berlin St
- 622 Cedartown Ave
- 0 Broad St Unit 10614514
- 0 Broad St Unit 10614479
- 0 Georgia 120 Unit 7646686
- 0 Georgia 120 Unit 10600882
- 154 Bethany St
- 0 N Ridge Dr Unit 7657923
- 0 N Ridge Dr Unit 10615294
- 438 Bowdon St
- 0 Creek Dr Unit 148038
- 711 Kay St
- 0 Cherokee Dr Unit 148037
- 871 Cherokee Dr
- 0 Steadman Rd Unit 10608314
- --- Steadman #32 Rd
- 35 James St
- 174 Faye St
- 194 Faye St
- 324 Bethany St
- 667 Woodland Brook Dr
- 681 Woodland Brook Dr
- 650 N Spring St
- 131 Berlin St
- 641 Woodland Brook Dr
- 115 Berlin St
- 146 E Side Dr
- 654 Woodland Brook Dr
- 682 Woodland Brook Dr
- 682 Woodland Brook Dr Unit 6
- 120 Berlin St
- 108 Berlin St
- 672 Woodland Brook Dr
- 0 Woodland Brook Dr Unit 7599932
- 0 Woodland Brook Dr Unit 8865709
- 0 Woodland Brook Dr
- 644 Woodland Brook Dr
- 140 Berlin St
- 91 Berlin St
- 661 Gold St