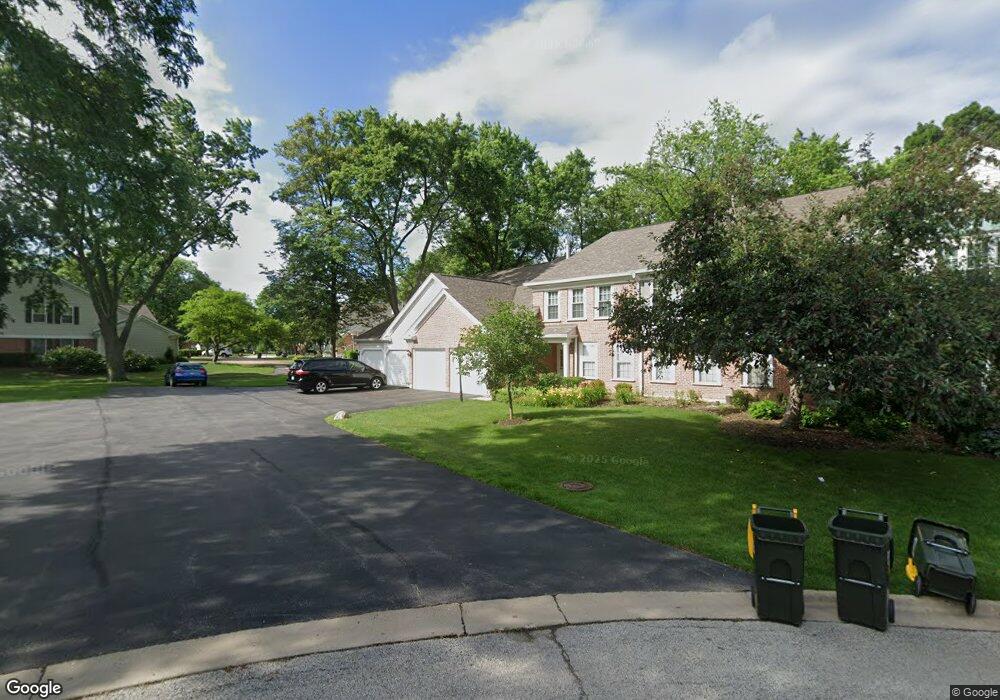
664 Pembridge Ln Unit 126107 Prospect Heights, IL 60070
Estimated Value: $300,497 - $365,000
2
Beds
--
Bath
1,165
Sq Ft
$288/Sq Ft
Est. Value
About This Home
This home is located at 664 Pembridge Ln Unit 126107, Prospect Heights, IL 60070 and is currently estimated at $335,374, approximately $287 per square foot. 664 Pembridge Ln Unit 126107 is a home located in Cook County with nearby schools including Euclid Elementary School, River Trails Middle School, and John Hersey High School.
Ownership History
Date
Name
Owned For
Owner Type
Purchase Details
Closed on
Sep 10, 2024
Sold by
Badell Himilse and Schroeder Malena
Bought by
Badell Himilse
Current Estimated Value
Purchase Details
Closed on
Mar 8, 2019
Sold by
Lavalle Arthur M and Lavalle Lisa A
Bought by
Badell Himilse and Schroeder Malena
Purchase Details
Closed on
Oct 25, 2001
Sold by
Lavalle Eileene and Lavalle Arthur M
Bought by
Lavalle Eileene and Lavalle Arthur M
Home Financials for this Owner
Home Financials are based on the most recent Mortgage that was taken out on this home.
Original Mortgage
$188,700
Interest Rate
6.8%
Mortgage Type
FHA
Purchase Details
Closed on
May 22, 1997
Sold by
Tatum Mary Lee
Bought by
Lavalle Armand V and Lavalle Eileene
Home Financials for this Owner
Home Financials are based on the most recent Mortgage that was taken out on this home.
Original Mortgage
$149,650
Interest Rate
8.27%
Mortgage Type
FHA
Create a Home Valuation Report for This Property
The Home Valuation Report is an in-depth analysis detailing your home's value as well as a comparison with similar homes in the area
Home Values in the Area
Average Home Value in this Area
Purchase History
| Date | Buyer | Sale Price | Title Company |
|---|---|---|---|
| Badell Himilse | -- | None Listed On Document | |
| Badell Himilse | -- | None Listed On Document | |
| Badell Himilse | $221,000 | None Available | |
| Lavalle Eileene | -- | -- | |
| Lavalle Armand V | $156,000 | Attorneys Natl Title Network |
Source: Public Records
Mortgage History
| Date | Status | Borrower | Loan Amount |
|---|---|---|---|
| Previous Owner | Lavalle Eileene | $188,700 | |
| Previous Owner | Lavalle Armand V | $149,650 |
Source: Public Records
Tax History Compared to Growth
Tax History
| Year | Tax Paid | Tax Assessment Tax Assessment Total Assessment is a certain percentage of the fair market value that is determined by local assessors to be the total taxable value of land and additions on the property. | Land | Improvement |
|---|---|---|---|---|
| 2024 | $4,040 | $18,626 | $1,677 | $16,949 |
| 2023 | $3,734 | $18,626 | $1,677 | $16,949 |
| 2022 | $3,734 | $18,626 | $1,677 | $16,949 |
| 2021 | $3,252 | $15,414 | $524 | $14,890 |
| 2020 | $3,259 | $15,414 | $524 | $14,890 |
| 2019 | $3,299 | $17,267 | $524 | $16,743 |
| 2018 | $2,485 | $14,438 | $419 | $14,019 |
| 2017 | $1,422 | $14,438 | $419 | $14,019 |
| 2016 | $2,049 | $14,438 | $419 | $14,019 |
| 2015 | $2,339 | $12,587 | $838 | $11,749 |
| 2014 | $2,265 | $12,587 | $838 | $11,749 |
| 2013 | $1,967 | $12,587 | $838 | $11,749 |
Source: Public Records
Map
Nearby Homes
- 212 Country Club Dr Unit 198
- 763 Sussex Corner Ln Unit 15
- 501 Aberdeen Ln Unit C
- 603 Thistle Ln Unit 16185
- 354 Country Club Dr
- 302 Lonsdale Rd
- 1214 N Crabtree Ln
- 203 Coldren Dr
- 703 Newcastle Ln
- 1121 N Greenfield Ln
- 1116 N Westgate Rd
- 206 E Camp Mcdonald Rd
- 1205 E Camp Mcdonald Rd
- 300 E Marion Ave
- 1000 N Westgate Rd
- 1142 N Boxwood Dr Unit B
- 1008 N Newberry Ln
- 1120 N Boxwood Dr Unit B
- 1622 E Greenwood Dr
- 1400 N Elmhurst Rd Unit 106
- 664 Pembridge Ln Unit 126107
- 664 Pembridge Ln Unit 126107
- 664 Pembridge Ln Unit 126107
- 664 Pembridge Ln Unit A
- 672 Pembridge Ln Unit A
- 672 Pembridge Ln Unit 126107
- 672 Pembridge Ln Unit 126107
- 672 Pembridge Ln Unit 126107
- 672 Pembridge Ln Unit 126107
- 672 Pembridge Ln Unit D
- 672 Pembridge Ln Unit B
- 661 Regent Ln Unit 11384
- 657 Pembridge Ln Unit 125106
- 657 Pembridge Ln Unit 125106
- 657 Pembridge Ln Unit 125106
- 657 Pembridge Ln Unit 125106
- 657 Pembridge Ln Unit A
- 663 Regent Ln Unit 11384
- 663 Regent Ln Unit F
- 662 Regent Ln Unit 11785L