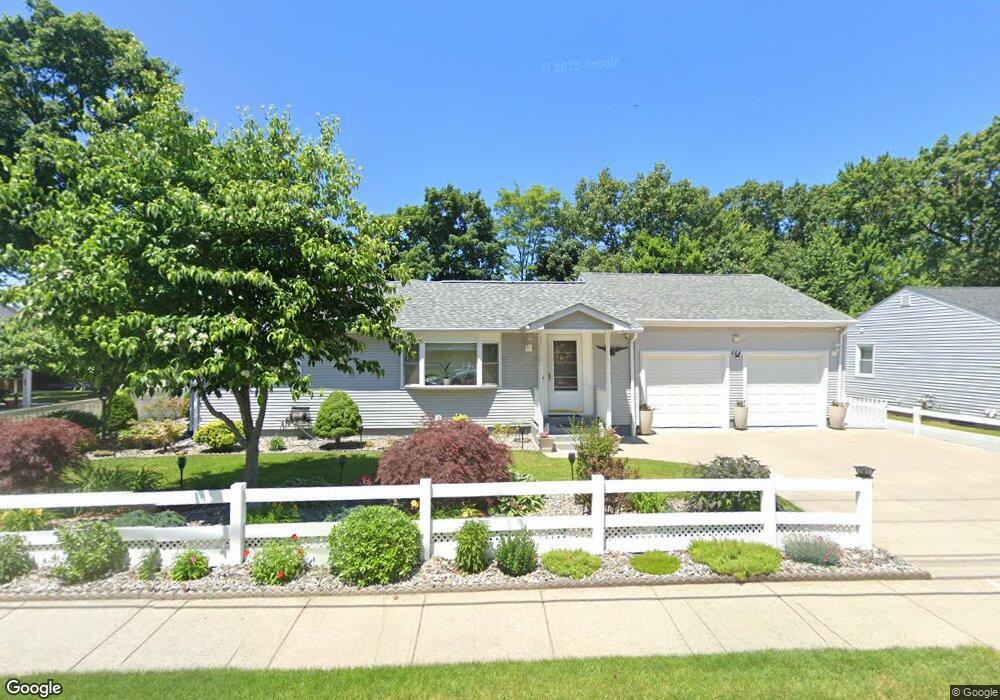
664 Pendleton Ave Chicopee, MA 01020
Fairview NeighborhoodEstimated Value: $315,506 - $349,000
2
Beds
1
Bath
912
Sq Ft
$360/Sq Ft
Est. Value
About This Home
This home is located at 664 Pendleton Ave, Chicopee, MA 01020 and is currently estimated at $328,127, approximately $359 per square foot. 664 Pendleton Ave is a home located in Hampden County with nearby schools including Bowie Elementary School, Fairview Middle School, and Chicopee Comprehensive High School.
Ownership History
Date
Name
Owned For
Owner Type
Purchase Details
Closed on
Sep 29, 2009
Sold by
Erhardt Robert D
Bought by
Lupa Bozena
Current Estimated Value
Home Financials for this Owner
Home Financials are based on the most recent Mortgage that was taken out on this home.
Original Mortgage
$85,000
Outstanding Balance
$56,152
Interest Rate
5.31%
Mortgage Type
Purchase Money Mortgage
Estimated Equity
$271,975
Purchase Details
Closed on
Jun 27, 2008
Sold by
Erhardt Glenn L
Bought by
Erhardt Robert D
Purchase Details
Closed on
Aug 13, 2004
Sold by
Erhardt Judith A and Erhardt Robert G
Bought by
Erhardt Glenn L and Erhardt Judith A
Purchase Details
Closed on
Mar 16, 1994
Sold by
Frederick George A and Frederick Cheryl L
Bought by
Erhardt Robert G and Erhardt Judith A
Home Financials for this Owner
Home Financials are based on the most recent Mortgage that was taken out on this home.
Original Mortgage
$78,400
Interest Rate
6.9%
Mortgage Type
Purchase Money Mortgage
Create a Home Valuation Report for This Property
The Home Valuation Report is an in-depth analysis detailing your home's value as well as a comparison with similar homes in the area
Home Values in the Area
Average Home Value in this Area
Purchase History
| Date | Buyer | Sale Price | Title Company |
|---|---|---|---|
| Lupa Bozena | $163,000 | -- | |
| Erhardt Robert D | -- | -- | |
| Erhardt Glenn L | -- | -- | |
| Erhardt Robert G | $98,000 | -- |
Source: Public Records
Mortgage History
| Date | Status | Borrower | Loan Amount |
|---|---|---|---|
| Open | Lupa Bozena | $85,000 | |
| Previous Owner | Erhardt Robert G | $95,200 | |
| Previous Owner | Erhardt Robert G | $78,400 | |
| Previous Owner | Erhardt Robert G | $34,000 |
Source: Public Records
Tax History
| Year | Tax Paid | Tax Assessment Tax Assessment Total Assessment is a certain percentage of the fair market value that is determined by local assessors to be the total taxable value of land and additions on the property. | Land | Improvement |
|---|---|---|---|---|
| 2025 | $4,298 | $283,500 | $107,400 | $176,100 |
| 2024 | $4,074 | $276,000 | $105,300 | $170,700 |
| 2023 | $3,841 | $253,500 | $95,700 | $157,800 |
| 2022 | $3,653 | $215,000 | $83,200 | $131,800 |
| 2021 | $3,460 | $196,500 | $75,700 | $120,800 |
| 2020 | $3,323 | $190,300 | $77,700 | $112,600 |
| 2019 | $3,271 | $182,100 | $77,700 | $104,400 |
| 2018 | $2,756 | $150,500 | $74,000 | $76,500 |
| 2017 | $2,695 | $155,700 | $68,500 | $87,200 |
| 2016 | $2,515 | $148,700 | $68,500 | $80,200 |
| 2015 | $2,505 | $142,800 | $68,500 | $74,300 |
| 2014 | $1,252 | $142,800 | $68,500 | $74,300 |
Source: Public Records
Map
Nearby Homes
- 52 Falmouth Rd
- 119 Oakridge St
- 1697 Westover Rd
- 70 Greenwood Terrace
- 460 Irene St
- 38 Applewood Dr
- 58 Robinridge Rd
- 37 Greenwood Terrace
- 103 Lauzier Terrace
- 111 Festival Cir
- 83 Old Farm Rd
- 130 Celebration Cir
- 104 Johnson Rd Unit 1103
- 104 Johnson Rd Unit 707
- 210 Johnson Rd Unit 23
- 1246 Granby Rd Unit 66
- 442 Prospect St
- 461 Sheridan St
- 81 Mccarthy Ave
- 15 Cross St
- 670 Pendleton Ave
- 654 Pendleton Ave
- 43 Falmouth Rd
- 51 Falmouth Rd
- 678 Pendleton Ave
- 648 Pendleton Ave
- 35 Falmouth Rd
- 663 Pendleton Ave
- 59 Falmouth Rd
- 675 Pendleton Ave
- 27 Falmouth Rd
- 686 Pendleton Ave
- 647 Pendleton Ave
- 640 Pendleton Ave
- 67 Falmouth Rd
- 15 Fernwood St
- 12 Oakwood St
- 692 Pendleton Ave
- 19 Falmouth Rd
- 634 Pendleton Ave
Your Personal Tour Guide
Ask me questions while you tour the home.