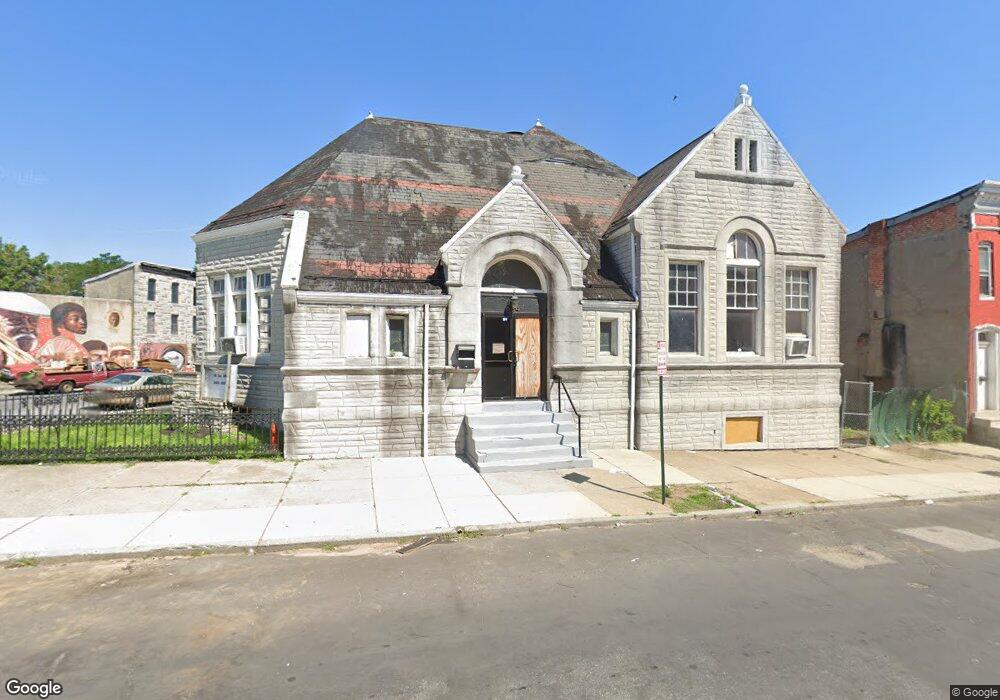
664 Pitcher St Baltimore, MD 21217
Upton NeighborhoodEstimated Value: $161,244
Studio
--
Bath
2,840
Sq Ft
$57/Sq Ft
Est. Value
About This Home
This home is located at 664 Pitcher St, Baltimore, MD 21217 and is currently estimated at $161,244, approximately $56 per square foot. 664 Pitcher St is a home located in Baltimore City with nearby schools including Booker T. Washington Middle School, Frederick Douglass High School, and Paul Laurence Dunbar High School.
Ownership History
Date
Name
Owned For
Owner Type
Purchase Details
Closed on
Jun 17, 2024
Sold by
Sheriff Of Baltimore City
Bought by
Greater Praise Christian Deliverance Church I
Current Estimated Value
Purchase Details
Closed on
Jan 20, 2016
Sold by
Rev Ps Llc
Bought by
Restore Such A One Deliverance Center In and Restoing Kingdon Church
Home Financials for this Owner
Home Financials are based on the most recent Mortgage that was taken out on this home.
Original Mortgage
$1,000
Interest Rate
3.54%
Purchase Details
Closed on
Jun 6, 2014
Sold by
Because He Lives Ministries
Bought by
Rev Ps Llc
Purchase Details
Closed on
Jan 5, 2007
Sold by
Spirit Of Truth Church
Bought by
Because He Lives Ministries
Home Financials for this Owner
Home Financials are based on the most recent Mortgage that was taken out on this home.
Original Mortgage
$280,000
Interest Rate
6.54%
Create a Home Valuation Report for This Property
The Home Valuation Report is an in-depth analysis detailing your home's value as well as a comparison with similar homes in the area
Home Values in the Area
Average Home Value in this Area
Purchase History
| Date | Buyer | Sale Price | Title Company |
|---|---|---|---|
| Greater Praise Christian Deliverance Church I | $130,000 | None Listed On Document | |
| Greater Praise Christian Deliverance Church I | $130,000 | None Listed On Document | |
| Restore Such A One Deliverance Center In | $89,500 | None Available | |
| Rev Ps Llc | $15,000 | None Available | |
| Because He Lives Ministries | $350,000 | -- |
Source: Public Records
Mortgage History
| Date | Status | Borrower | Loan Amount |
|---|---|---|---|
| Previous Owner | Restore Such A One Deliverance Center In | $1,000 | |
| Previous Owner | Because He Lives Ministries | $280,000 |
Source: Public Records
Tax History
| Year | Tax Paid | Tax Assessment Tax Assessment Total Assessment is a certain percentage of the fair market value that is determined by local assessors to be the total taxable value of land and additions on the property. | Land | Improvement |
|---|---|---|---|---|
| 2025 | $1,819 | $79,900 | $29,100 | $50,800 |
| 2024 | $1,819 | $77,433 | -- | -- |
| 2023 | $1,769 | $74,967 | $0 | $0 |
| 2022 | $1,711 | $72,500 | $29,100 | $43,400 |
| 2021 | $1,711 | $72,500 | $29,100 | $43,400 |
| 2020 | $1,711 | $72,500 | $29,100 | $43,400 |
| 2019 | $1,996 | $85,000 | $29,100 | $55,900 |
| 2018 | $1,645 | $69,700 | $0 | $0 |
| 2017 | $1,284 | $54,400 | $0 | $0 |
| 2016 | -- | $83,000 | $0 | $0 |
| 2015 | -- | $83,000 | $0 | $0 |
| 2014 | -- | $334,033 | $0 | $0 |
Source: Public Records
Map
Nearby Homes
- 1533 Argyle Ave
- 1107 Winchester St
- 1133 N Carrollton Ave
- 1109 N Carrollton Ave
- 1150 N Carrollton Ave
- 1025 N Carrollton Ave
- 531 Wilson St
- 1123 N Carey St
- 1117 N Carey St
- 910 N Arlington Ave
- 1346 N Fremont Ave
- 1213 Mosher St
- 1026 N Carey St
- 1834 Brunt St
- 529 W Mosher St
- 1004 N Carey St
- 721 W Lafayette Ave
- 1306 N Carey St
- 536 Laurens St
- 1007 W Lafayette Ave
- 662 Pitcher St
- 660 Pitcher St
- 658 Pitcher St
- 656 Pitcher St
- 654 Pitcher St
- 1111 N Fremont Ave
- 652 Pitcher St
- 650 Pitcher St
- 1107 N Fremont Ave
- 1102 N Fremont Ave
- 641 Pitcher St
- 648 Pitcher St
- 631 Pitcher St
- 639 Pitcher St
- 637 Pitcher St
- 646 Pitcher St
- 1104 N Fremont Ave
- 635 Pitcher St
- 1106 N Fremont Ave
- 644 Pitcher St
Your Personal Tour Guide
Ask me questions while you tour the home.